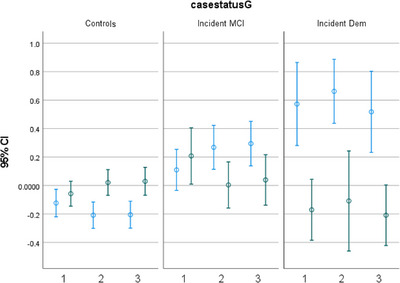
FIGURE 2.

Two patterns (PCA1 and PCA2) derived from principal component analyses of the blood‐based biomarkers at the three clinical visits over the period of follow‐up. Mean (95% confidence interval [CI]) of the biomarker pattern scores (Y axis) at visits 1, 2, and 3 (X axis), in cognitively unimpaired, incident mild cognitive impairment (MCI), and incident dementia (Dem) participants. Blue represents PCA1, and green represents PCA2.
