
FIGURE 5.
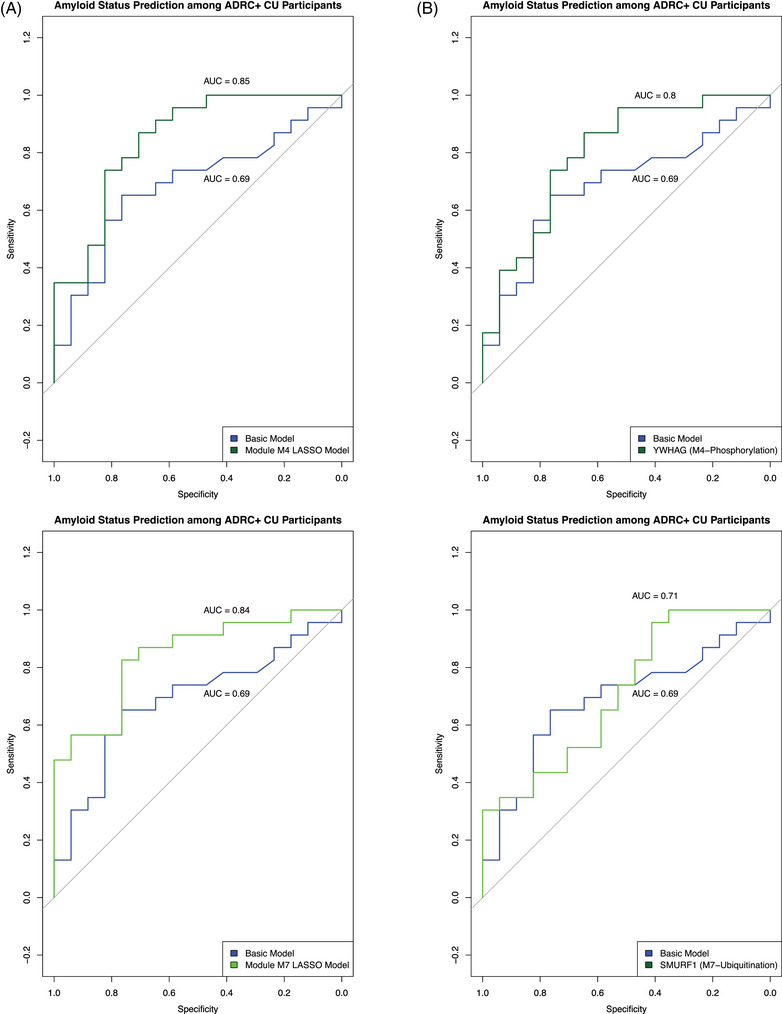
Module M3's prediction of amyloid status using LASSO regression with stability selection. (A) Receiver‐operating characteristic (ROC) curves depicting the classification performance (sensitivity vs specificity) of models predicting amyloid status among a test set of CU ADRC+ participants. In blue are results from a basic logistic regression model including APOE ε4 allele count, sex, and age (AUC = 0.71). In either dark green or green are results from a LASSO regression model derived from module M4‐phosphorylation or M7‐ubiquitination proteins, respectively, along with the previously mentioned demographic and genotype factors. (C) ROC curves similar to those in (A), except in dark green or green are results from a logistic regression model including only stable model features, along with APOE ε4 allele count: YWHAG for M4‐phosphorylation and SMURF1 for M7‐ubiquitination.