FIGURE 1.

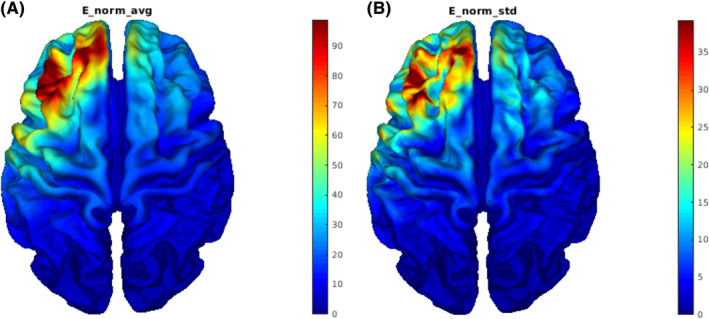
Visualization of (A) mean (V/m) and (B) standard deviation (V/m) of electric‐field norms from simulations across subjects.

Visualization of (A) mean (V/m) and (B) standard deviation (V/m) of electric‐field norms from simulations across subjects.