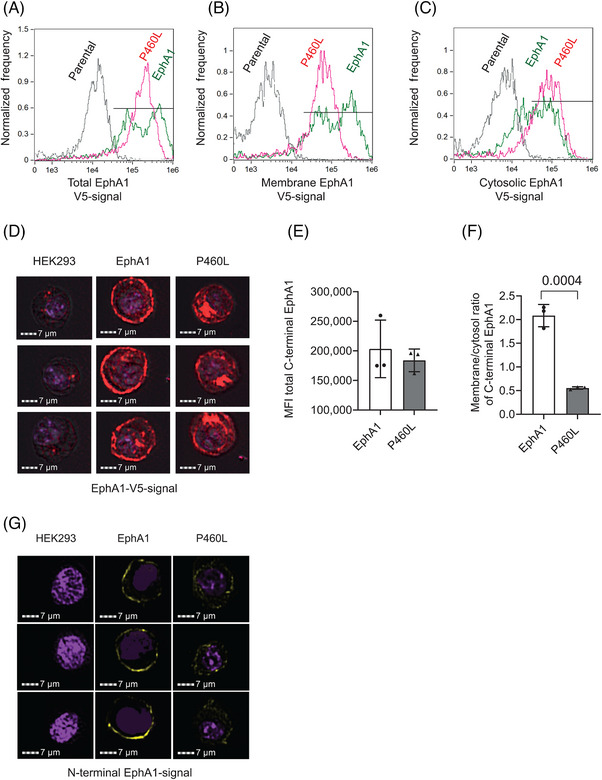
FIGURE 3.

Subcellular localization of EphA1 receptor within EphA1‐ and P460L‐expressing HEK293 cells. EphA1, P460L, and parental HEK293 cell lines were stained for EphA1 receptor expression by staining for V5‐tagged cytotail or for N‐terminal ectodomain and subcellular localization of receptors analyzed by imaging flow cytometry. See Figure S3 for creation of membrane and cytosolic subcellular masks of live, single HEK293 cells. (A) Representative overlay histograms showing total level of receptor expression in parental (black), EphA1 (green), and P460L (pink) HEK293 cells. (B) Representative overlay histograms showing EphA1 receptor expression present within membrane of parental (black), EphA1 (green), and P460L (pink) HEK293 cells. (C) Representative overlay histograms showing EphA1 receptor expression present within cytosol of parental (black), EphA1 (green), and P460L (pink) HEK293 cells. (D) Representative images generated by ImageStream showing distribution of EphA1 receptor expression within parental (left), EphA1 (middle) and P460L (right) HEK293 cells. (E) Median fluorescence intensity of total V5‐tagged EphA1 receptor in EphA1 and P460L HEK293 cells. (F) Ratio of receptor expression in the membrane and cytosolic subcellular compartments of EphA1 and P460L HEK293 cells. (G) Representative confocal microscope images of N‐terminal EphA1 receptor expression in parental (left), EphA1 (middle), and P460L (right) HEK293 cells. Bars represents mean ± SD, n = 3. Statistical analysis used Student t test.
