
FIGURE 5.
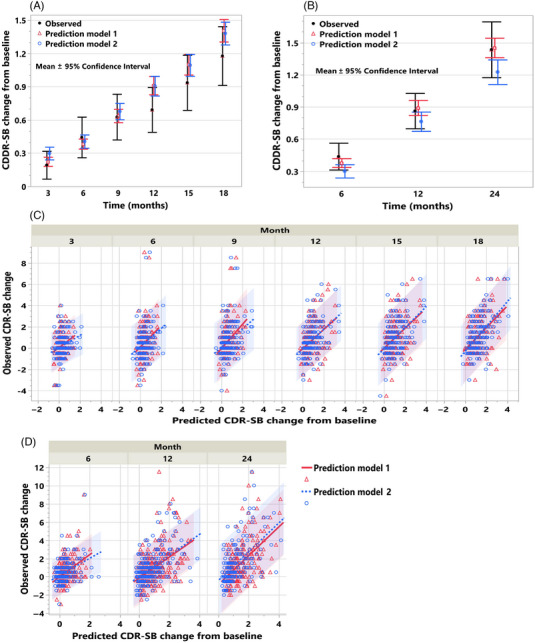
(A‐D) Prognostic prediction of average cognitive decline and cognitive decline of individual subjects in the two validation cohorts. Mean and 95% confidence interval of the observed and predicted CDR‐SB change from baseline using the models based on the baseline clinical features (model 1) alone and with the addition of MRI‐based SBN features (model 2) are shown in (A) for validation cohort (VC) 1 and in (B) for VC 2. The observed versus predicted CDR‐SB change from baseline for individual subjects at each time point from models 1 and 2 along with the 95% prediction intervals are shown for VC 1 in (C) and VC 2 in (D).