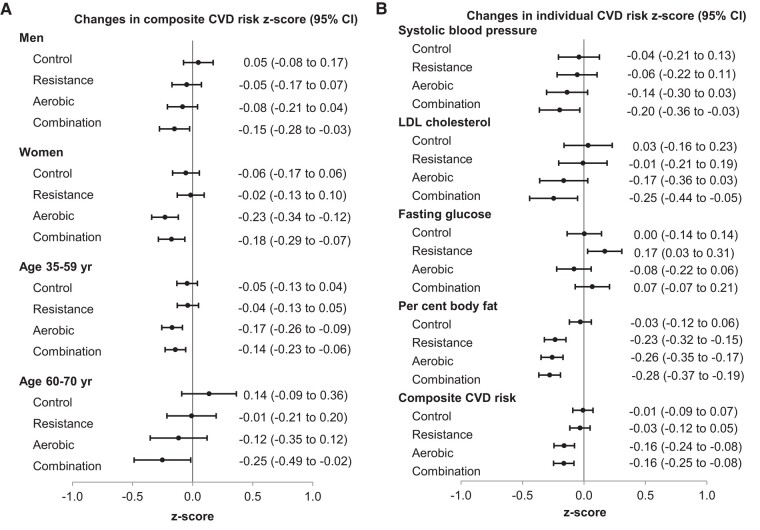
Figure 2.
Changes in the cardiovascular disease risk factors from baseline to 1 year. Results are from the linear mixed effects models with repeated measures in the intention-to-treat analyses including all 406 randomized participants. The figure shows mean changes in the standardized Z-scores of the composite cardiovascular disease risk factors by sex and age groups (A) and mean changes in the standardized Z-scores of the individual and composite cardiovascular disease risk factors (B). P-values for interaction by sex were .22, .70, .09, and .78 in the control, resistance, aerobic, and combination groups, respectively. P-values for interaction by the age groups were .14, .79, .67, and .40 in the control, resistance, aerobic, and combination groups, respectively. Z-score values below 0 indicate favourable changes in cardiovascular disease risk factors. Whiskers indicate 95% confidence intervals. CVD, cardiovascular disease; LDL, CI, confidence interval

