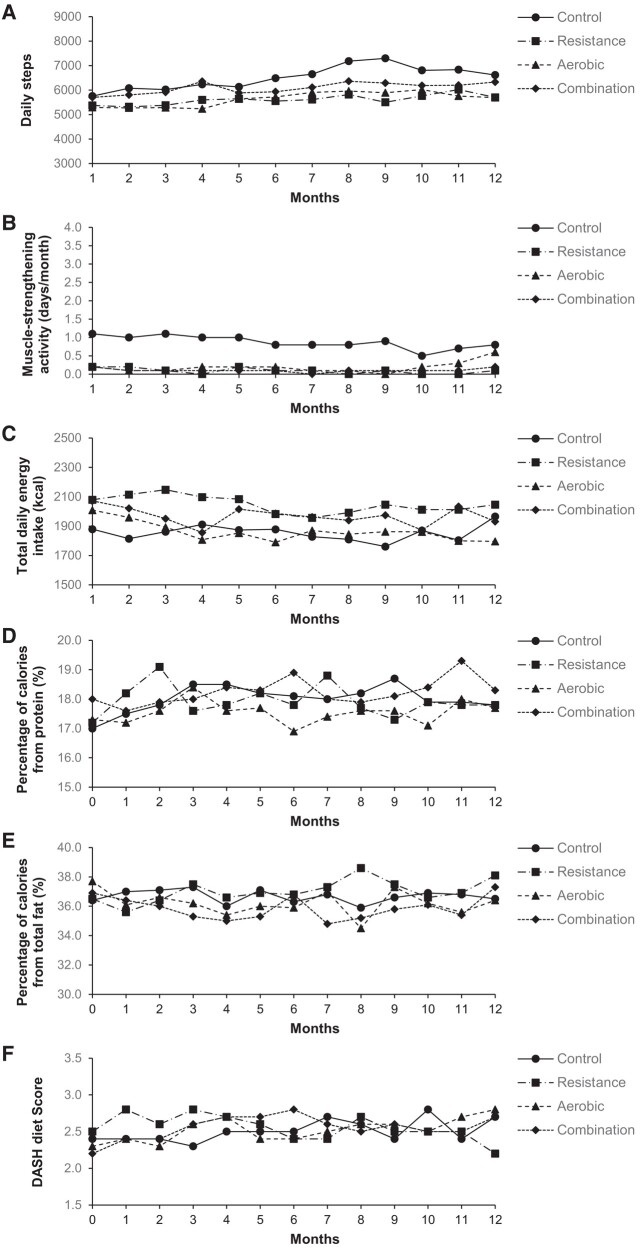
Figure 4.
Mean changes in lifestyle physical activity and diet during 12 months. The figure shows the mean changes in daily steps (A), muscle-strengthening activity (B), total daily energy intake (C), percentage of calories from protein (D), percentage of calories from total fat (E), and Dietary Approaches to Stop Hypertension diet score (F). Average numbers of participants across groups from Month 1 to Month 12 were 99, 95, 93, 92, 89, 87, 84, 80, 78, 76, 74, and 73, respectively, for physical activity (daily steps and muscle-strengthening activity) and 95, 88, 88, 83, 81, 79, 76, 74, 72, 68, 66, and 46, respectively, for diet (total daily energy intake, percentage of calories from protein, percentage of calories from total fat, and Dietary Approaches to Stop Hypertension diet score). P-values for group-by-time interactions are as follows: P = .37 for daily steps, P = .97 for muscle-strengthening activity, P = .67 for total daily energy intake, P = .42 for percentage of calories from protein, P = .43 for percentage of calories from total fat, and P = .53 for Dietary Approaches to Stop Hypertension diet score. DASH, Dietary Approaches to Stop Hypertension [ranges from 0 (low DASH accordance) to 9 (high DASH accordance)].

