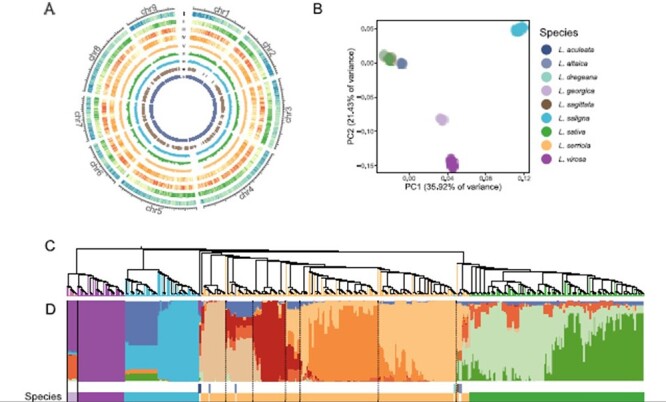
Figure 2.

Variant calling and population structure of the sequenced Lactuca accessions. (A) The distribution of genomic features and variant density based on the new v11 genome assembly. The Circos plot shows from the outmost gene density (I), GC content (II), SNP count (III), indel count (IV), nucleotide diversity in L. serriola (V), nucleotide diversity in L. sativa (VI), fixation index between L. serriola and L. sativa (VII) calculated in 1-Mb sliding windows and selective sweeps (VIII) and newly assembled region in the v11 assembly (IX). (B) PCA of 440 Lactuca accessions. (C) A neighbor-joining tree. (D) Model-based clustering analysis with ancestry kinship of 10.
