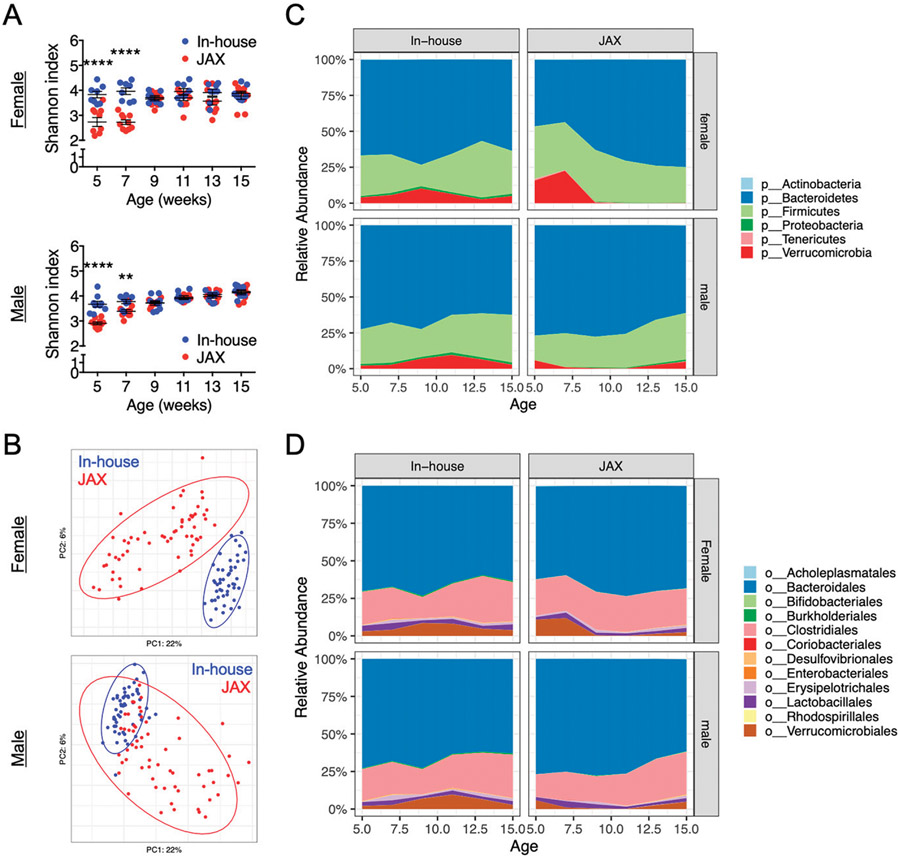
FIGURE 6. Analysis of gut microbiota composition.
(A) Shannon diversity index over time for the fecal microbiota of female (top) and male (bottom) MRL/lpr mice. Statistical significance between groups (**p < 0.01, ****p < 0.0001) is shown based on two-way ANOVA. (B) Principal coordinate analysis of fecal microbiota composition for female (top) and male (bottom) MRL/lpr mice. (C) Changes of relative bacterial abundance over time at the phylum level in the fecal microbiota of female (top) and male (bottom) MRL/lpr mice. (D) Changes of relative bacterial abundance over time at the order level in the fecal microbiota of female (top) and male (bottom) MRL/lpr mice.

