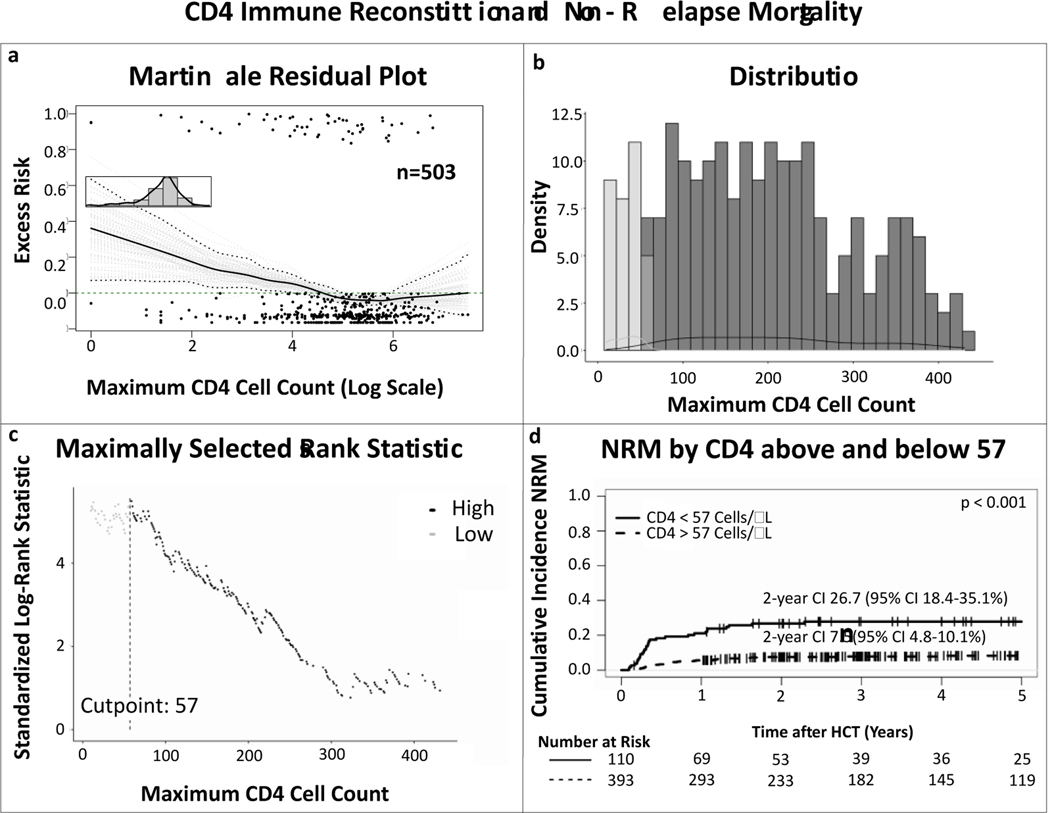
Figure 2. Linearity and maximally selected log-rank statistics analyses on the correlation between CD4 immune reconstitution and non-relapse mortality.
(a) Martingale residual plot demonstrating excess risk of non-relapse mortality by highest achieved absolute CD4 count in the first 100 days after allo-HCT. The nonlinear trajectory of the curve indicates there is no linear correlation between CD4 cell count and non-relapse mortality, (b) distribution of the CD4 values, (c) maximally selected log-rank statistics determining an absolute CD4 count of 57 as the cut off for NRM, (d) cumulative incidence curves of NRM comparing patients who achieved a maximum CD4 count > 57 (dotted line) and those who did not (solid line), confirming a significant difference between the two groups. P value depicts significance of CD4 IR > 57 as predictor in univariable competing risk analyses by the Fine-Gray method.

