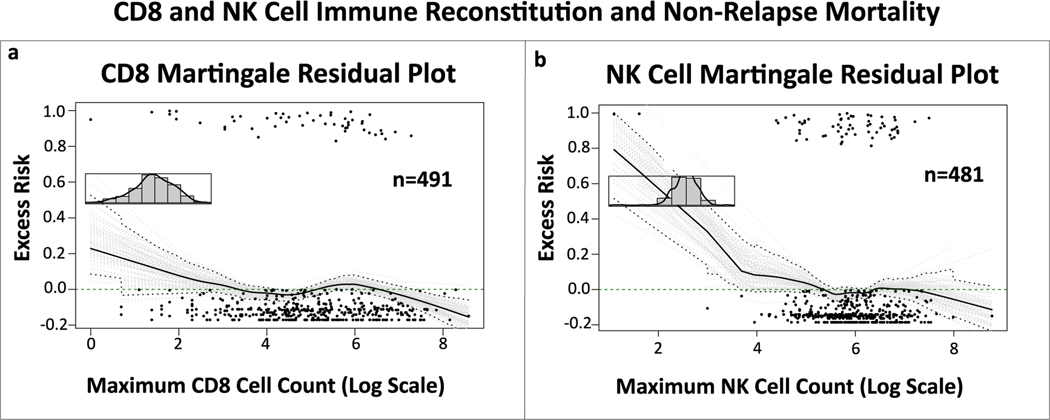
Figure 4. Martingale residual plots depicting linearity between CD8 and NK cell immune reconstitution and non-relapse mortality.
Martingale residual plots demonstrating excess risk of non-relapse related mortality by (a) highest achieved absolute CD8 and (b) NK cell count in the first 100 days after allo-HCT. Although both curves seem to indicate non-linearity, the initial slope downwards of the curves has a wide confidence interval due to small number of measurements. When looking at the confidence interval in the area with most measurements, the 0.0 excess risk line continues to be within the conficence interval, indicating a linear correlation.

