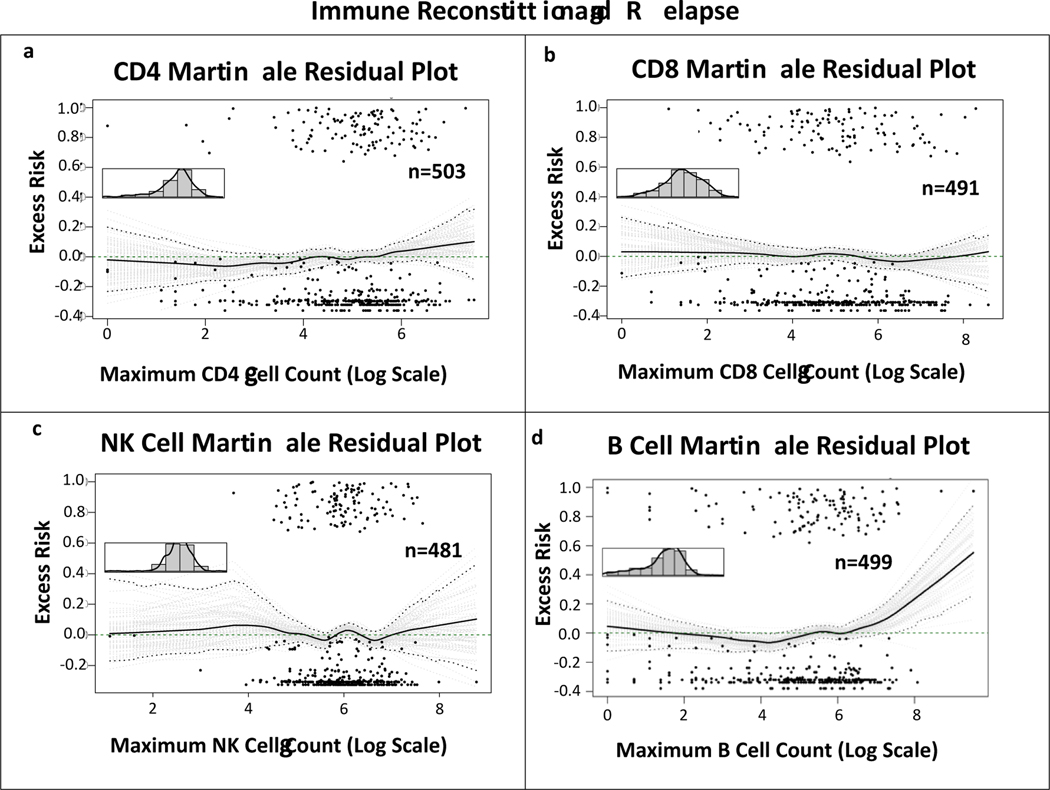
Figure 5. Linearity analyses on the correlation between CD4, CD8, NK and B cell immune reconstitution and relapse.
Martingale residual plots demonstrating excess risk of relapse by highest achieved absolute (a) CD4, (b) CD8, (c) NK and (d) B cell count in the first 100 days after allo-HCT. The curves in a-c show the 0.0 excess risk line falls within the conficence interval throughout, indicating linearity between variables and relapse. Although in curve d the curve seems to have an upward slope, that is due to two outliers. In the area of most datapoints, the 0.0 excess risk line falls within the confidence interval, indicating linearity.

