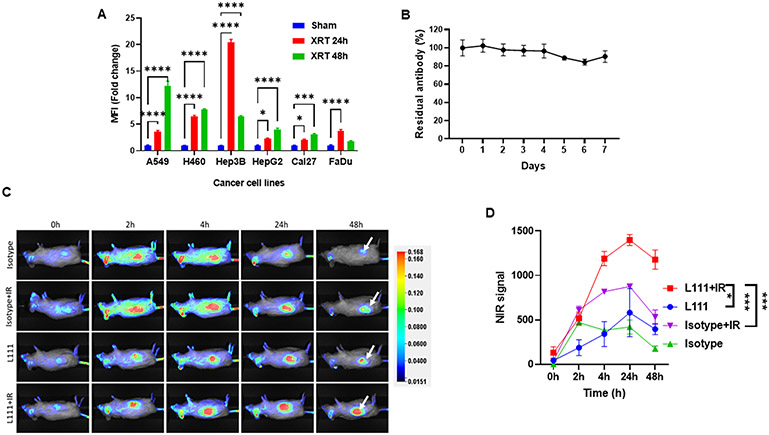
Figure 3. L111 antibody targets human cancer cells in vitro and patient-derived xenografts in vivo.
A. Bar graph showing the fold-change in median fluorescence intensities representing the binding of the L111 antibody on the surface of cancer cells. Lung cancer (A549 and H460), liver cancer (Hep3B and HepG2), and head and neck cancer (Cal27 and FaDu) cells were either sham-irradiated or irradiated with three doses of 3 Gy radiation. Cells were harvested 24 or 48 h post irradiation, and the surface binding of L111 was evaluated by flow cytometry. XRT: Three doses of 3 Gy. B. In vitro, the serum stability of L111 in human serum was evaluated by ELISA assay over seven days. The line graph shows the mean±SD of the % of the residual antibody as detected by ELISA assay. C. Representative NIR images show L111 uptake in the PDX tumors (white arrows). A PDX from a lung adenocarcinoma patient was established in NSG mice in the right flank. Tumors were either sham-irradiated or irradiated with 3 Gy. IRDye 800 labeled L111 was injected via the tail vein, and whole-body NIR imaging was performed at the indicated time points. D. Line graph representing background subtracted NIR signal intensities vs. time post L111 antibody injection. *P<0.05, ***P<0.001, ****P<0.0001

