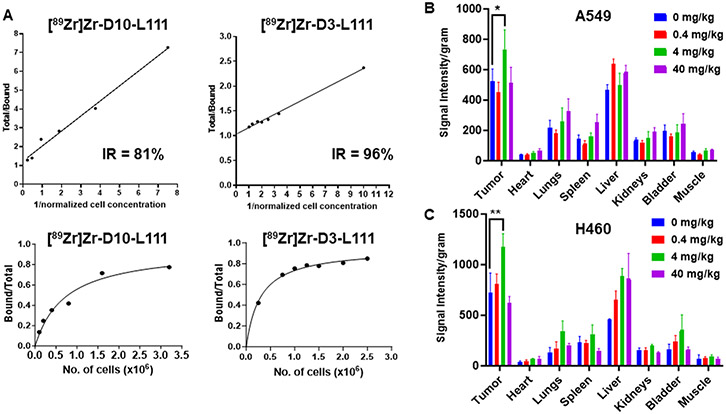
Figure 5. In vitro and In vivo evaluation of the L111 antibody.
A. Immunoreactivity of the [89Zr]Zr-D10-L111 and [89Zr]Zr-D3-L111 on the cancer cell surface. The graphs show the percentage of the immunoreactive fraction. B and C. Bar graphs showing Near-infrared signal intensity per gram of the organs harvested from nude mice bearing subcutaneous A549 (B) and H460 (C) tumors (n=3). The mice were injected with 0 to 40 mg/kg unlabeled L111 prior to injecting IRDye800 labeled L111. Organs were harvested after five days of L111 injection. *P<0.05, **P<0.01

