Figure 1:

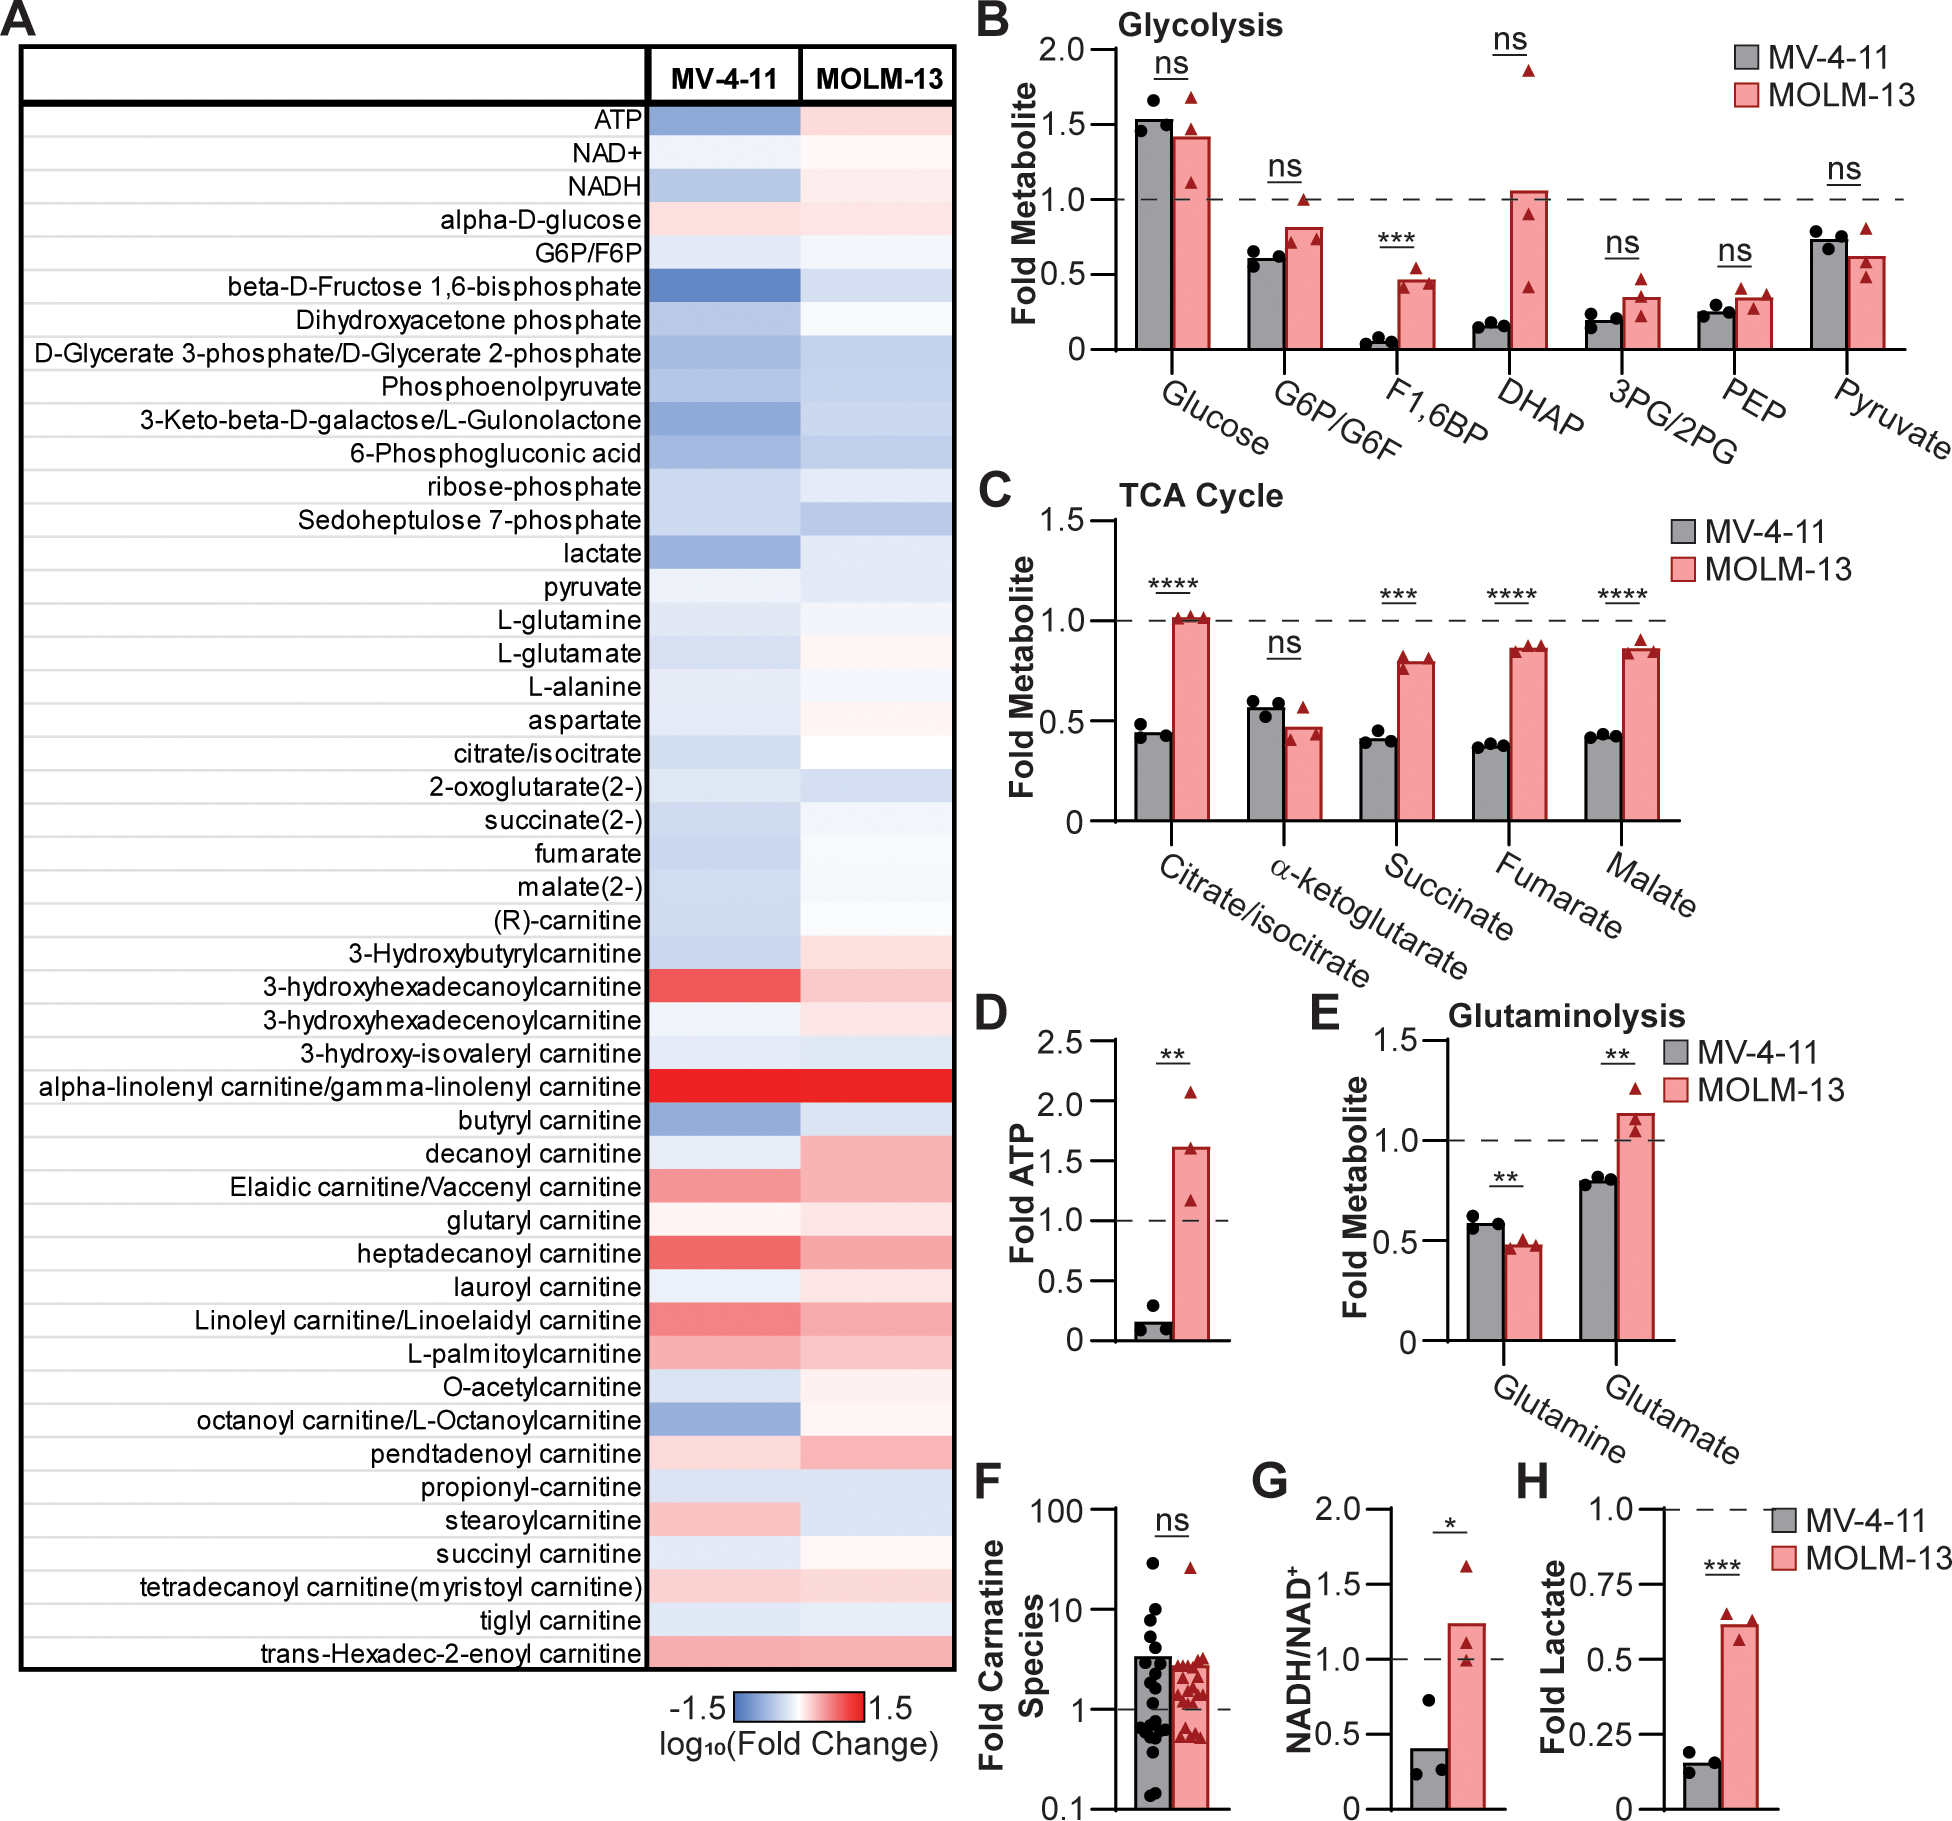
MOLM-13 cells better maintain TCA cycle metabolic activity following BET inhibition. MV-4–11 and MOLM-13 cells were treated with 300 nM of BETi for 48 hr and then subjected to mass spectrometry to assess global metabolite concentrations. (A) Data is presented as log10(Fold change) relative to mock-treated cells. Fold change in (B) glycolytic and (C) TCA cycle metabolites, (D) ATP, (E) glutaminolysis metabolites, (F) total carnitine species, (G) NADH/NAD+ ratio, and (H) lactate is presented. Each point represents (B-E, G, H) independent biological replicates or (F) mean result of individual carnitine species (biological triplicate) (n=3). (B-H) unpaired t test (*P ≤ 0.05, **P ≤ 0.01, ***P ≤ 0.001, ****P ≤ 0.0001, ns = not significant).
