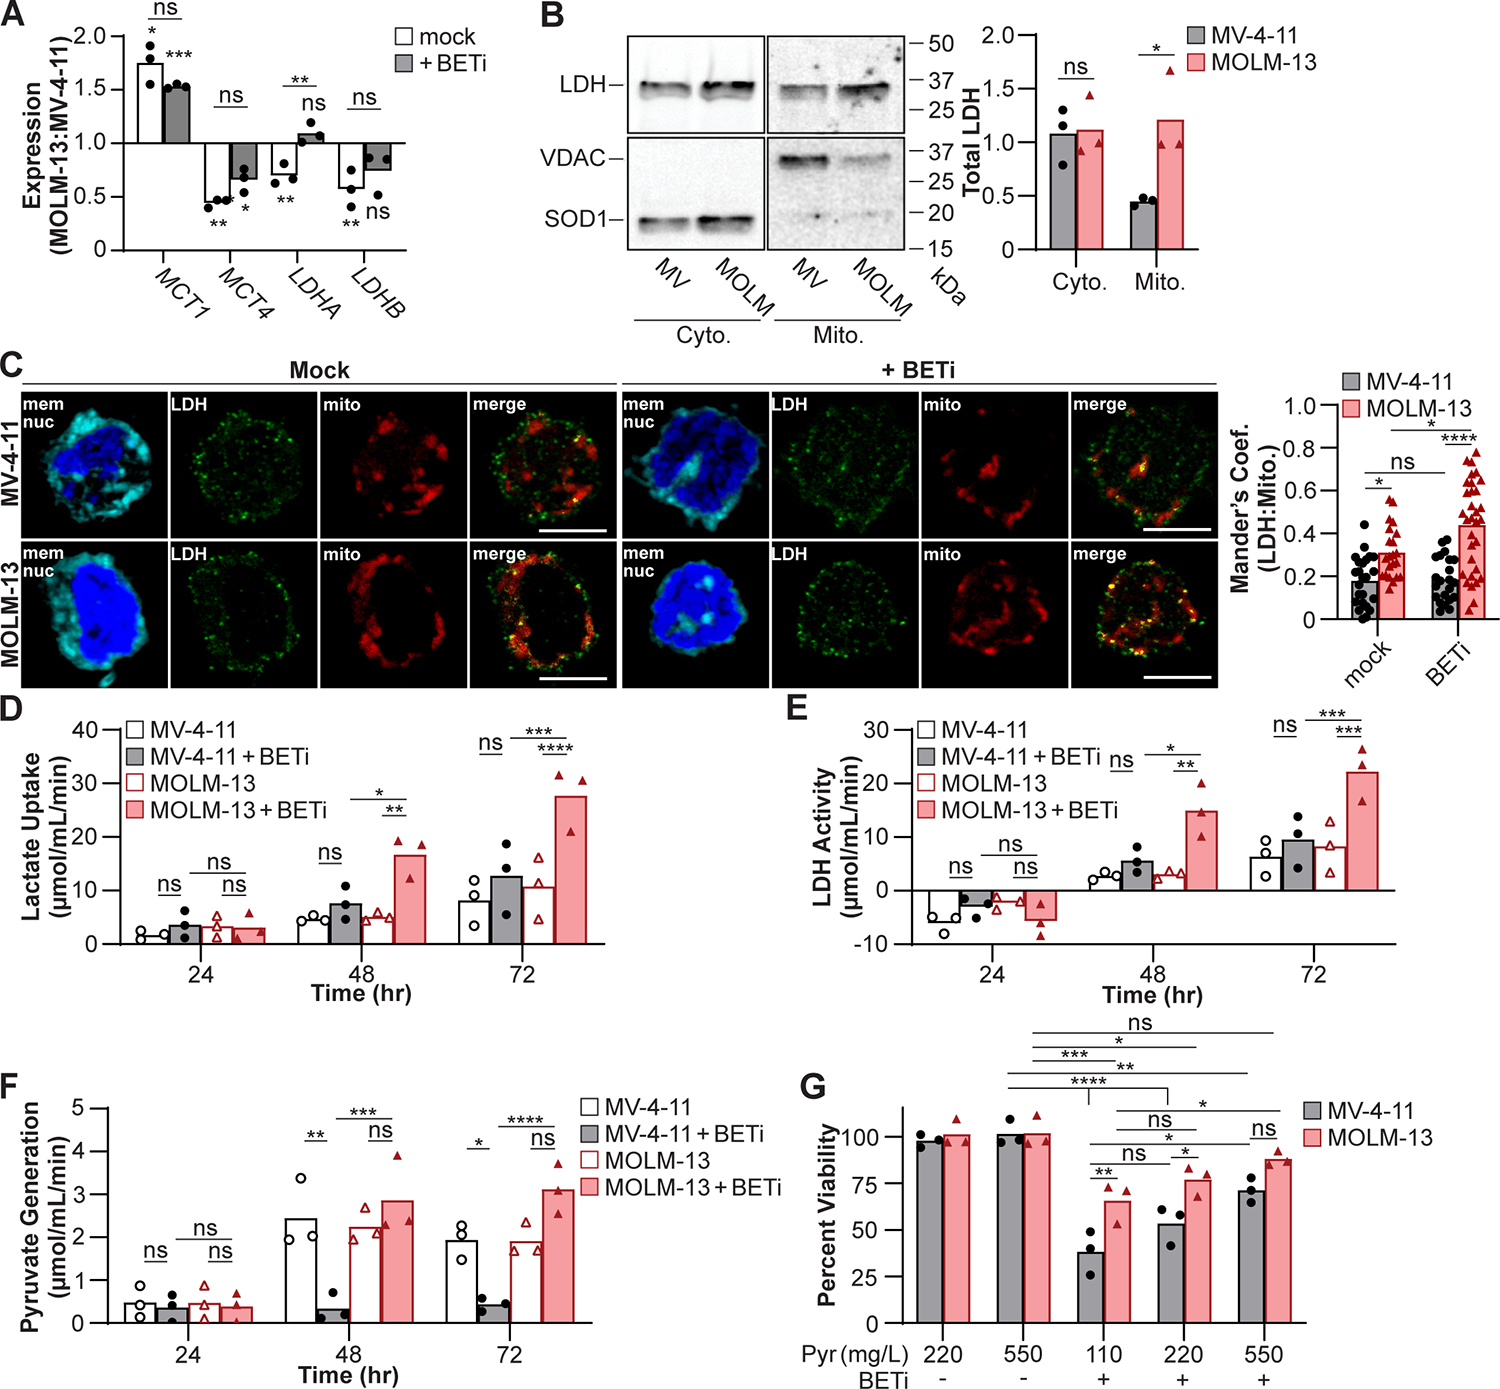
Figure 2:

MOLM-13 cells are predisposed to utilize lactate upon BETi treatment. (A) Cells were mock treated or treated with BETi for 48 hr and gene expression associated with lactate homeostasis quantified in MOLM-13 cells relative to MV-4–11 by qPCR. (B) MV-4–11 (MV) and MOLM-13 (MOLM) cells were fractionated and LDH protein in the cytosolic (Cyto.) and mitochondrial (Mito.) fractions quantified by immunoblot. Superoxide dismutase 1 (SOD1) and voltage-dependent anion channel (VDAC) protein were immunoblotted to ensure clean fractionation. (C) Cells were treated with BETi for 48 hr and Mander’s coefficient of colocalization between LDH and mitochondria quantified by fluorescent imaging. (D-F) Cells were treated with BETi, and the media exchanged at indicated timepoints with minimal media with and without oxamate (25 μM) or CPI-613 (200 μM) or lysed to quantify baseline metabolite levels. Minimal media was subsequently supplemented with lactate (20 μM) for 2 hr, cells lysed, and intracellular lactate and pyruvate levels quantified using a fluorescent plate reader (C, Lactate Uptake = oxamate-treated – baseline; D, LDH Activity = oxamate-treated – mock-treated; E, Pyruvate Generation = CPI-613-treated – baseline). (F) Cells were cultured for 72 hr with BETi in media supplemented with sodium pyruvate (Pyr) and viability quantified using a fluorescent plate reader. Viability was quantified relative to vehicle control treated cells at 110 mg/L pyruvate. (A, D-G) Each point represents the mean (technical triplicate), (B) total obtained from an individual experiment (n=3), (C) or individual cell. (A-B) Paired t test or two-way ANOVA with (C, G) Sidak’s or (D-F) Tukey multiple comparisons test (*P ≤ 0.05, **P ≤ 0.01, ***P ≤ 0.001, ****P ≤ 0.0001, ns = not significant).
