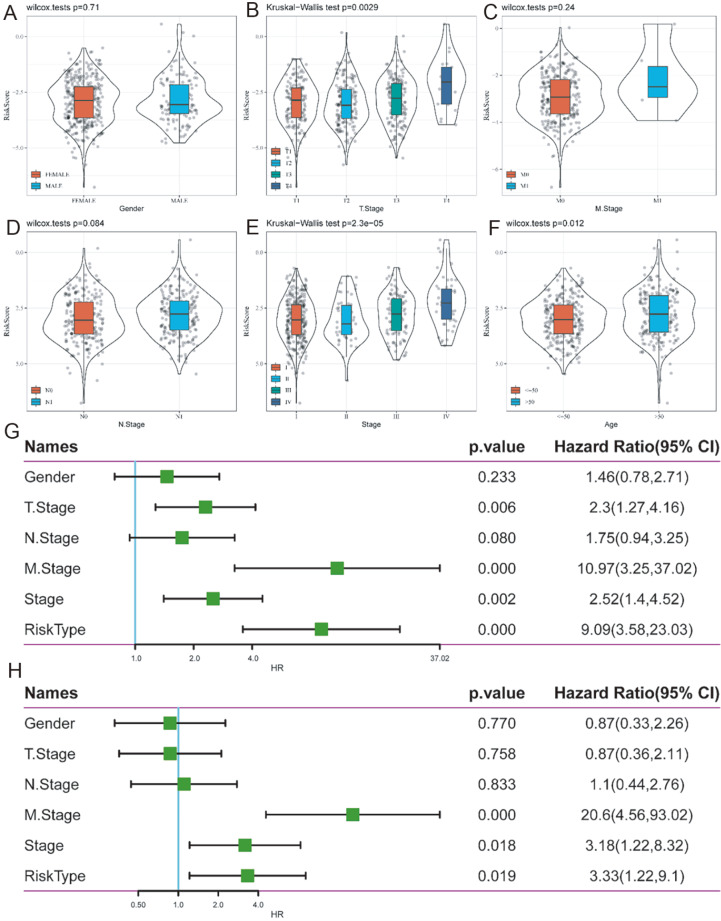
Figure 3 .
The relationship between the 5-gene molecular prognostic model and clinical features
(A) Risk score on female and male. (B) Risk score on T stage (P<0.05). (C) Risk score on M stage. (D) Risk score on N stage. (E) Risk score on stage (P<0.05). (F) Risk score on age (P<0.05). (G) Forest plot of univariate Cox regression analysis in TCGA cohort. (H) Forest plot of multivariable Cox regression analysis in TCGA cohort.

