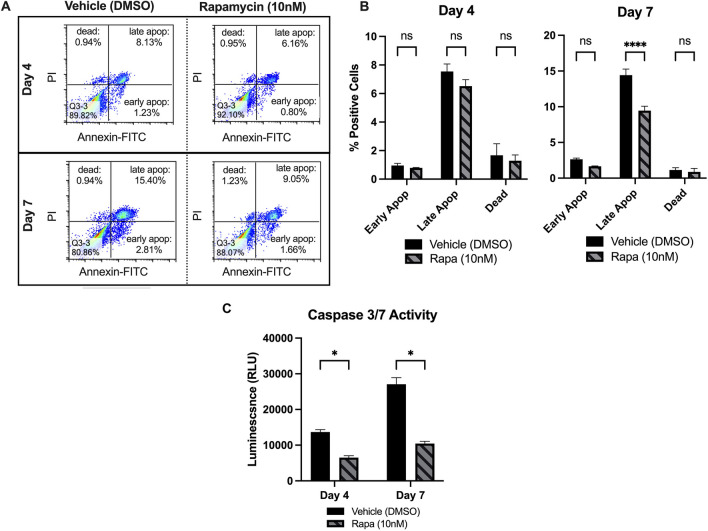
Fig. 2.
A Annexin-V and Propidium Iodide (PI) staining was used to assess apoptosis at days 4 and 7 of sheet culture, where the bottom right segment of each plot represents the population of cells in early apoptosis, the top right segments represent the late apoptosis populations, and the top left segments represent the dead cell populations (B) At day 4, the rapamycin treated PMSCs had less cells in early and late apoptosis, however, these decreases did not reach statistical significance. The rapamycin group had an average of 0.79 ± 0.026% of cells in early apoptosis, compared to 0.95 ± 0.157% for the vehicle group (p = 0.69, n = 3). Further, the rapamycin group had 6.5 ± 0.46% of cells in late apoptosis, compared to 7.54 ± 0.53% for the vehicle group (p = 0.02, n = 3). The rapamycin PMSCs also had a slight, non-significant decrease in the percentage of dead cells (p = 0.33, n = 3). At day 7, the rapamycin group had a significant decrease in the percentage of cells in late apoptosis (9.46 ± 0.62% of rapamycin-treated PMSCs vs. 14.42 ± 0.85% for control, p = 3.8x10⁻⁸, n = 3). Further, the rapamycin-treated PMSCs had an insignificant decrease in number of cells in early apoptosis (1.66 ± 0.05% versus 2.63 ± 0.175, p = 0.033, n = 3). The rapamycin-treated PMSCs had a nonsignificant decrease in the percentage of dead cells (0.866 ± 0.5% vs. 1.14 ± 0.31%, p = 0.51, n = 3). C Caspase 3 and 7 activity was assessed as a secondary measure of apoptosis at day 4 and 7, which confirmed a decrease in apoptosis at both timepoints. The rapamycin treatment group had a 52.4% decrease at day 4 (p = 1.3x10⁻⁴, n = 3) and a 61.4% decrease at day 7 (p = 1.3x10⁻⁴, n = 3). Note: *p < 0.05, **p < 0.01, ***p < 0.0001

