Fig. 2.
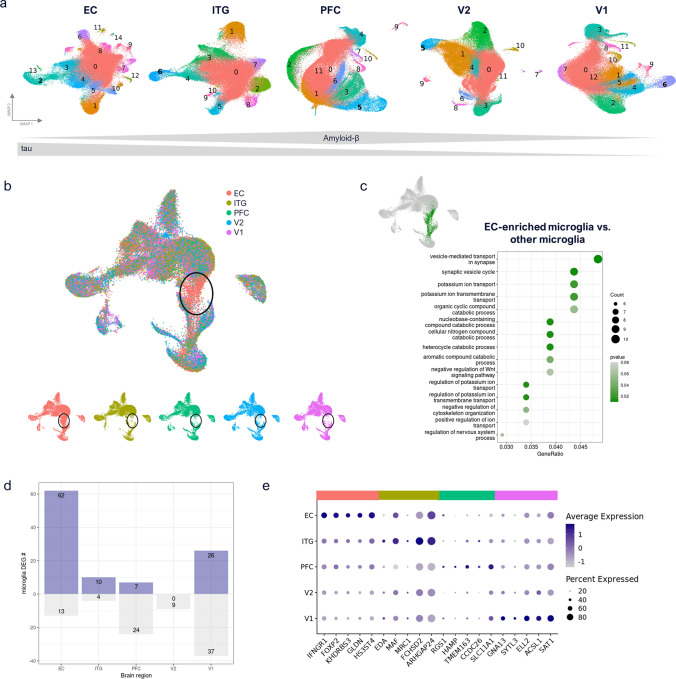
Brain myeloid cell similarity across brain regions. a Brain myeloid cell subclustering per brain region. Macrophage cluster numbers are indicated in bold (based on LYVE1, MRC1, CD163, and F13A1 marker genes). b Cross-region integration of subsampled brain myeloid cells across brain regions shows alignment between regions for most cells, except for one EC-enriched population of cells (highlighted in black circles). Shown are combined and per region UMAP plots. c EC enriched population (indicated as green cells in UMAP plot) was compared to all other brain myeloid cells across regions. Biological process GO term enrichment indicates upregulated synapse vesicle cycle changes and ion transport differences. d Up- and downregulated differentially expressed gene (DEG) numbers per region, filtered for microglial genes (average log2FC > 0.25). e Top 5 upregulated microglia genes per region (no significantly upregulated V2 markers identified)

