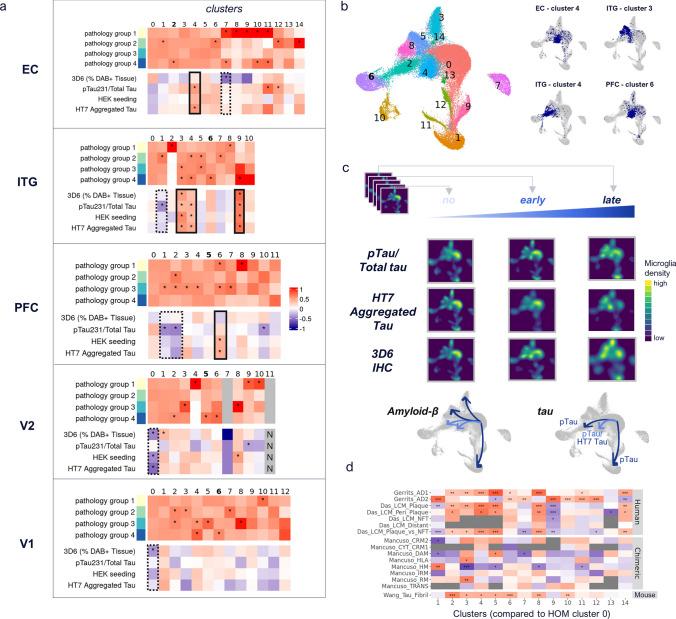
Fig. 3.
Identification of tau- and Aβ -associated microglia and brain macrophage subpopulations. a Per cluster pathology group enrichment shown as observed over expected ratios (scaled to 1) (upper panels of heatmaps) and Spearman correlation of 3D6 and tau readouts with proportion of brain myeloid cells per cluster (lower panels of heatmaps). ‘*’corresponds to significant enrichment > = 10% (binomial test, adj. p value < 0.001), and significant Spearman correlation (p value < 0.05), respectively. Solid black boxes denote clusters positively correlated with pathology; dashed black boxes denote clusters negatively correlated with pathology. Bold cluster numbers indicate macrophage clusters, characterized by increased expression of LYVE1, MRC1, F13A1, and CD163. b Mapping of disease-associated clusters per region (right) to cross-region integrated data (left) confirms similarity of disease-associated clusters across brain regions, albeit indicating expression differences between primarily tau- (clusters 2/4 in integrated data) and tau + Aβ -associated clusters (clusters 5/8 in integrated data). c 3D6 IHC, pTau/Total tau, and HT7 aggregated tau readouts were binned into 5 equally spaced categories, representing no-to-late pathology. For simplicity, integrated microglia are shown for no, early, and late pathology only (first, middle, last bin), based on their cellular density in individual clusters (UMAP representation). Grey plots beneath visually summarize shifts of brain myeloid cells into clusters stratified for early (lightblue) and late (darkblue) pathology. For HT7 aggregated tau, bin #4 (not #5) is shown at late stage, as last bin (#5) only contained data from one donor. d Spearman correlation of cross-region brain myeloid cell clusters (using DEGs per cluster vs. cluster 0) with public genelists. Significant correlation indicated by ***p value < 0.001, **p value < 0.01, *p value < 0.05, grey boxes indicate insufficient data (number of overlapping genes between data sets < 10). AD1 and AD2 human microglia signatures from [16]; laser capture microdissected samples from [9] with signatures “Das_LCM_Plaque” (ThioflavinS + plaques), “Das_LCM_Peri_Plaque” (50 µm area around plaques), “Das_LCM_NFT” (neurofibrillary tangles with the 50µm area around them), “Das_LCM_Distant” (area > 50µm away from plaques), “Das_LCM_Plaque_vs_NFT” (ThioflavinS + plaques vs. neurofibrillary tangles); human iPSC-derived microglia-like cells transplanted into mice, with signatures CRM2 cytokine response 2, CYT/CRM1 cytokine response 1, DAM (disease associated), HLA antigen-presenting response, HM homeostatic, IRM (Interferon response), RM (ribosomal response), TRANS transitioning CRM from [32]; and primary mouse microglia tau fibril response genes from [51]

