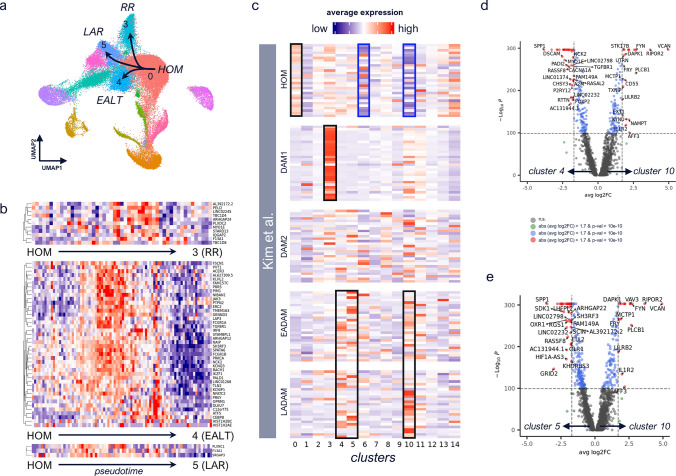
Fig. 4.
Microglia subtype conversion in human. a Trajectories to disease-associated clusters were identified with monocle3 [50]. b For individual trajectories 0 (HOM)–3 (RR), 0–4 (EALT), and 0–5 (LAR), transitionally upregulated genes were identified by splitting pseudotime into quartiles and filtering for genes expressed at a higher level in middle quartiles (transitionally higher expressed) compared to 1st and 4th one, the latter representing cluster-enriched expression in HOM, or disease-associated cluster, respectively. c Expression of top 30 genes per microglial phenotype (HOM, DAM1, DAM2, EADAM, LADAM) identified in [28], averaged per cluster in cross-region integrated brain myeloid cells. Red indicates high average expression levels; blue indicates low average expression levels. Clear upregulation of HOM (cluster 0) and DAM1 (cluster 3) phenotypes are observed, as well as enriched expression of LADAM and EADAM genes across clusters 4, 5, and 10, indicated by black boxes. Clusters 6 and 10 show strong relative downregulation of homeostatic microglia markers, as indicated by blue boxes. d,e Volcano plots showing genes differentially expressed between cluster 4 and 10 (d), and cluster 5 and 10 (e)

