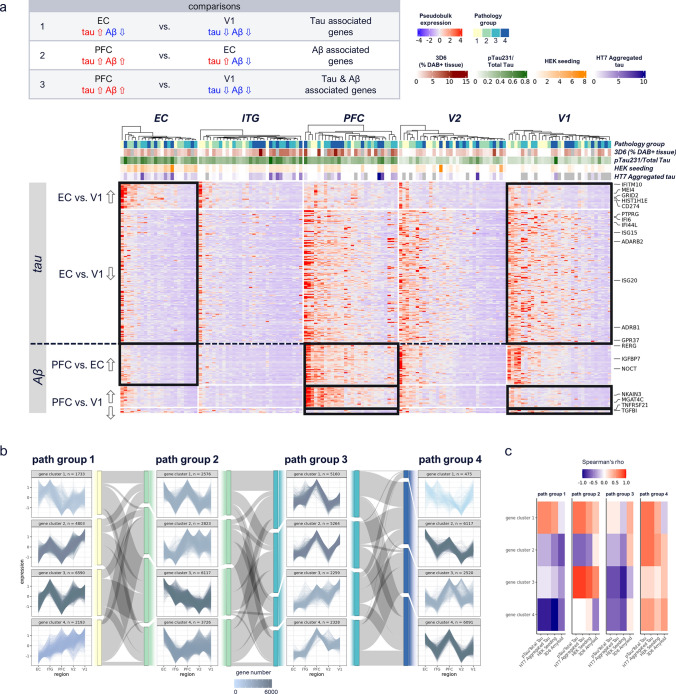
Fig. 5.
Tau- and Aβ-associated brain myeloid cell signatures. a Heatmap of differentially expressed genes (DEGs) up- (⇧) or down- (⇩) regulated in EC vs. V1, PFC vs. EC and PFC vs. V1 regions, within pathology group 4. Tau-driven changes (EC vs. V1) include interferon-related genes, while Aβ driven and tau & Aβ-driven changes (PFC vs. EC, PFC vs. V1) include growth factor, and cytokine signaling related genes, respectively. Results were adjusted for gender and respective pathology group 1 DEGs were filtered out. Color-coding of aggregated expression per sample (column) and gene (row), annotation shows pathology group, 3D6 Aβ IHC, pTau/Total Tau, HEK seeding, and HT7 Aggregated Tau. Filtering for DEGs based on nominal p value < 0.01 and logFC > 1.2. Expression patterns included in respective comparisons are indicated by black boxes; expression patterns of other regions are shown for completeness. b K-means gene clustering across regions, per pathology group. Gene numbers are color-coded. Sankey diagrams, color-coded according to pathology group, show percentage change of genes from given gene clusters in one pathology group to gene clusters in next pathology group. Pathology group 3 and 4 gene clusters spike in PFC region, suggesting Aβ influenced expression, while pathology group 1 and 2 contain also gene clusters showing linear correlation along regions. c Spearman correlation per pathology group of each gene cluster with biochemical readouts; overall highest correlation is observed in pathology group 4, across gene clusters. High correlation is indicated by red and low correlation by blue color

