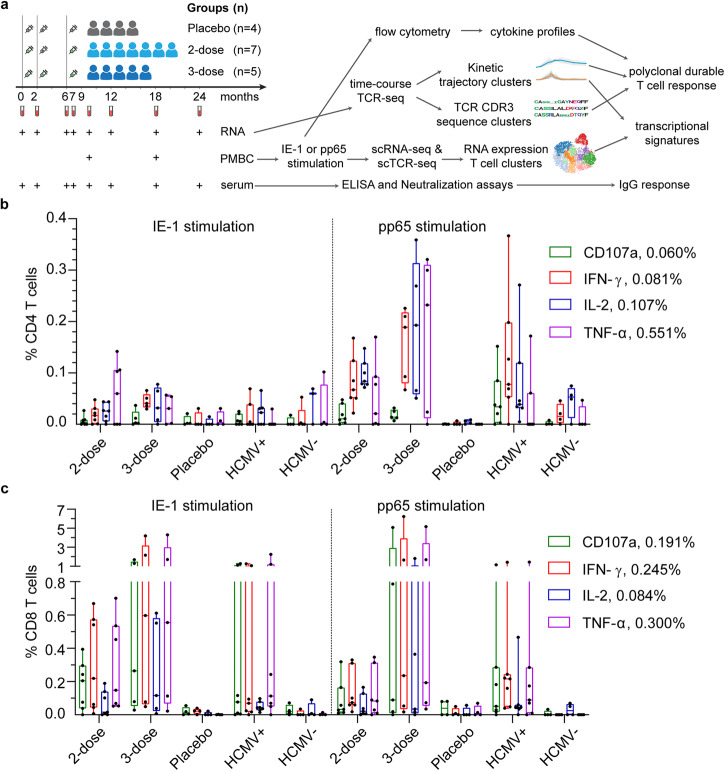
Fig. 1. V160 induced IE-1 and pp65 T-cell responses as compared to natural HCMV infection.
a Overview of study design, sample collection, experiments, and analyses. Month 9 PBMCs of the 2-dose group (n = 7), 3-dose group (n = 5), and placebo group (n = 4) together with PBMCs of HCMV+ donors (n = 7) and HCMV− donors (n = 4) were analyzed for T-cell responses to IE-1 and pp65 by intracellular cytokine staining (ICS) flow cytometry. b and c Percentages of (b) CD4 T cells and (c) CD8 T cells that expressed four kinds of effector molecules (CD107a, IFN-γ, IL-2, and TNF-α) after DMSO background subtraction (supplementary data file 1). Data are plotted in a box and whiskers style showing the median (center line), the first quartile, and the third quartile together with all data points. Black dots indicate individual responses. Positive cutoffs of specific T-cells were calculated from the median plus a two-fold standard error of the mean of background responses in all individuals (Supplementary Fig. 2) and were shown next to the corresponding legend.

