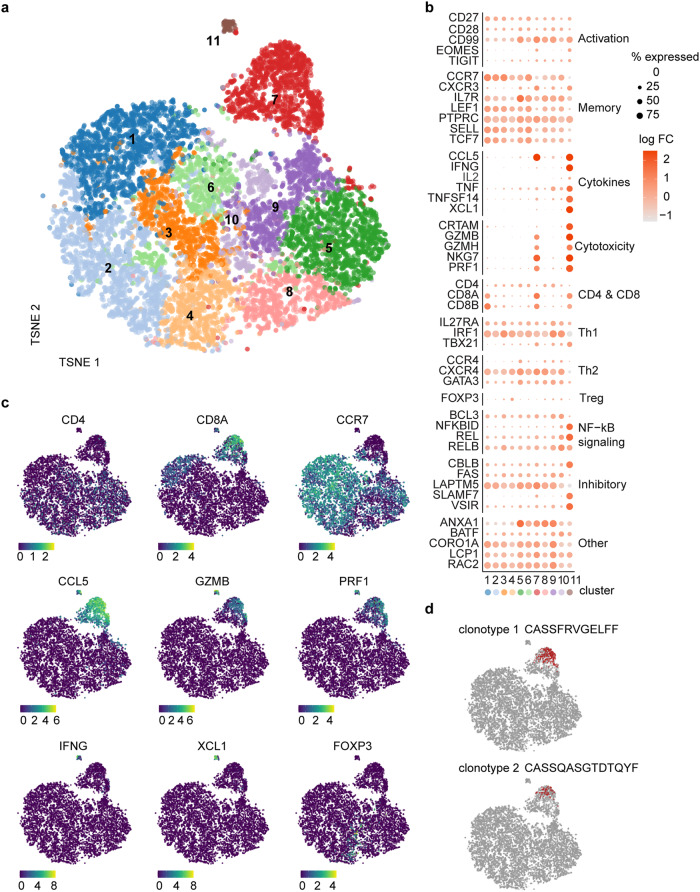
Fig. 3. Transcriptional makeup of CD3+ T cells post V160 vaccination.
a Single-cell transcriptomes of enriched CD3+ T cells from IE-1 and pp65 stimulated month 18 PBMC of S26 were shown as a t-distributed stochastic neighbor embedding (TSNE) plot, colored based on RNA expression cluster assignment by the Louvain graph-based method. b Percentage of cells expressing selected genes within each expression cluster (size scale) and log fold change (FC) of expression within each cluster vs. other clusters (color scale). c Expression levels of selected genes are shown as color overlays on the TSNE plot from (a). d Highlighting of T cells of the two most prevalent clonotypes (with CDR3β sequences shown) on the TSNE plot.

