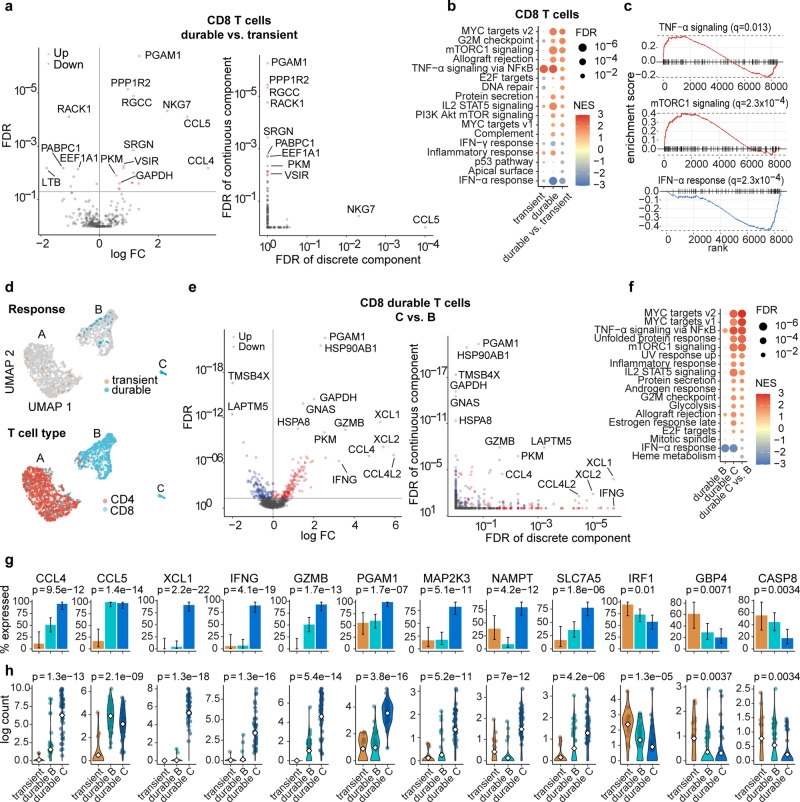
Fig. 6. Transcriptional signature of V160-responsive “durable” expanded CD8 T cells.
a Left, Volcano plots of scRNA-seq differential expression analysis of “durable” vs. “transient” expanded CD8 T cells. Right, Breakdown of the statistical significance of differential expression into the discrete component (expressed vs. non-expressed) and continuous component (changes in expression level given that the gene is expressed). Each dot summarizes the result for a gene. FDR: false discovery rate. FC: fold change. b Summary of gene set enrichment analyses for responsive “transient” vs. non-responsive, responsive “durable” vs. non-responsive, and responsive “durable” vs. “transient” expanded CD8 T cells. NES, normalized enrichment score. c Gene set enrichment plots for selected significant pathways in the differential expression of “durable” vs. “transient” expanded CD8 T cells. Dashed lines represent minimum and maximum cumulative enrichment scores. d Uniform manifold approximation (UMAP) plots of T cells from expression clusters enriched for “transient” or “durable” expanded V160-responsive clones identified in Fig. 4b. Cells are colored by V160 response type (top) or T cell type (bottom). e Left, Volcano plots of scRNA-seq differential expression analysis of V160 responsive “durable” CD8 T cells subcluster C vs. B in (d). Right, Breakdown down the statistical significance of differential expression into the discrete and continuous components. f Summary of gene set enrichment analyses for V160 responsive “durable” CD8 T cells subcluster C vs. all other CD8 T cells; subcluster B vs. all other CD8 T cells; or subcluster C vs. B. NES, normalized enrichment score. g Percentages of cells expressing selected genes within each V160 responsive T cell cluster. Significance was assessed by Fisher’s exact test. Error bars indicate the mean ± standard error of the mean. h Violin plots showing the distributions of log single-cell expression counts in each response group. Each filled dot represents the log expression of a cell expressing the gene. Open diamonds represent mean log expression. Significance was determined by the Kruskal–Wallis test.

