
Figure 1.
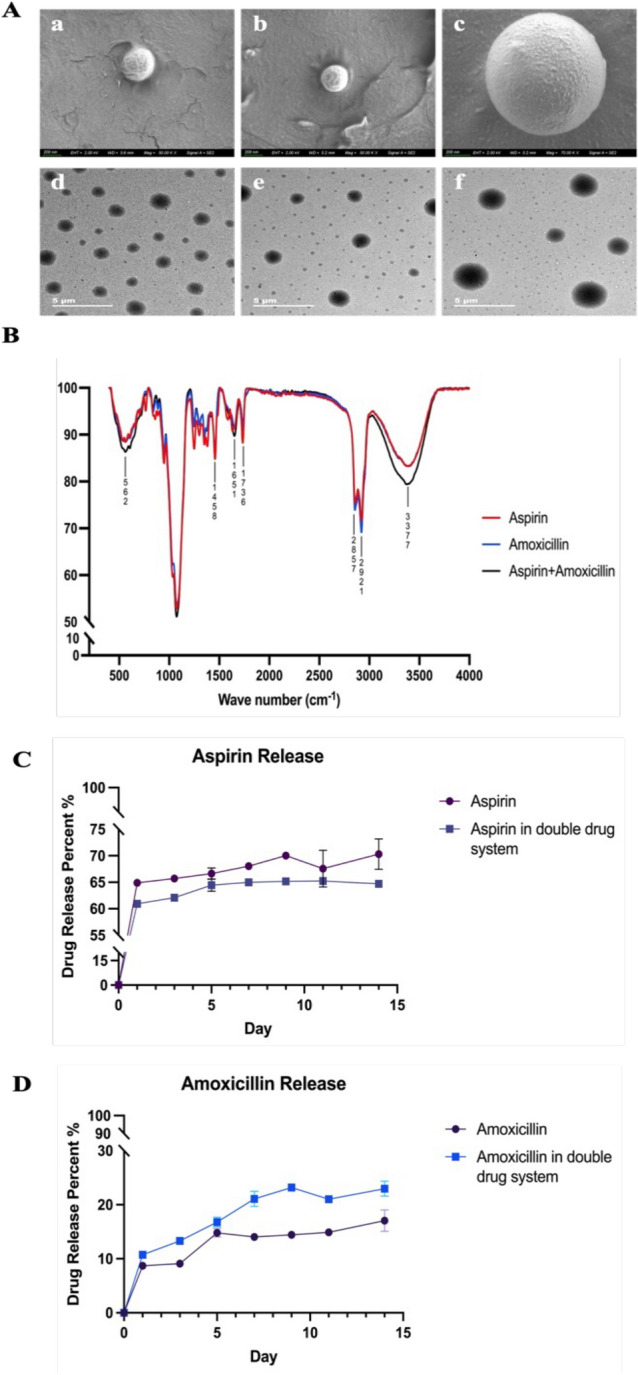
SEM images of (A.a) CS-ASA MPs, (A.b) CS-AMO MPs and (A.c) CS-ASA/AMO MPs showing the size of the drug-loaded chitosan particles at ×50 K and ×70 K. TEM images of (A.d) CS-ASA MPs, (A.e) CS-AMO MPs and (A.f) CS-ASA/AMO MPs showing the surface topography of the drug-loaded chitosan particles at ×2 K. FT-IR spectra of three kinds of drug-loaded chitosan microspheres (B). Drug sustained release percent diagram of (C) aspirin release in single drug-loaded particles and double drug-loaded particles and (D) amoxicillin release in single drug-loaded particles and double drug-loaded particles in potassium phosphate buffer (pH 7.4).