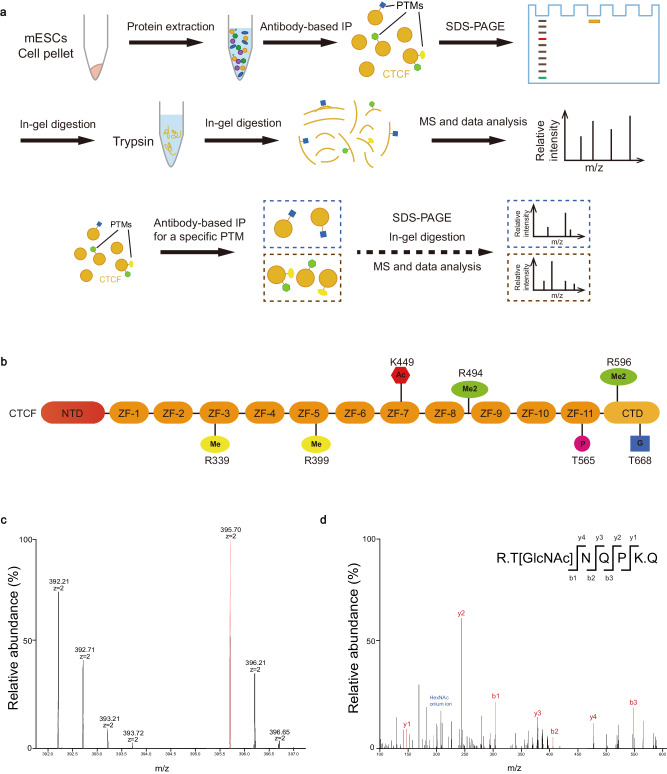
Fig. 1. The PTM profiling of CTCF.
a Schematic overview of the identification of PTMs. b Illustration of the PTM sites of CTCF identified in mESCs. Me mono-methylarginine, Me2 dimethylarginine, Ac acetylation, P phosphorylation, G O-GlcNAcylation. c, d, LC–MS/MS spectra of an O-GlcNAcylated peptide of endogenous CTCF derived from mESCs and CTCF was purified by immunoprecipitation with antibody. The matched fragment ions were labeled in red. See also Supplementary Fig. 1.

