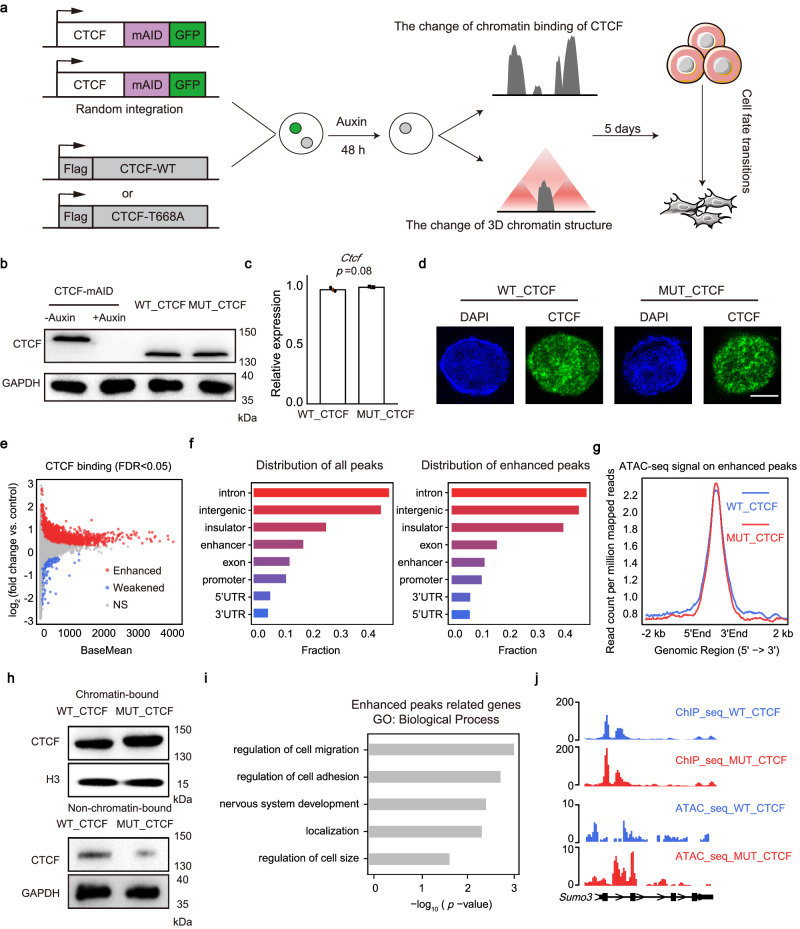
Fig. 3. Deficiency of O-GlcNAcylation enhances chromatin binding of CTCF.
a Scheme of the research route and methods in the section on function research. b Western blot of total cell lysates from CTCF-mAID cells before (lane1) or after auxin treatment (lane2), WT_CTCF cells, and MUT_CTCF cells after 48 h auxin treatment to detect the expression of CTCF. GADPH was shown as a loading control. This experiment was performed three times, with similar results. c The relative expression of Ctcf in WT_CTCF and MUT_CTCF mESCs. Data were presented as mean ± SD (n = 3 biologically independent samples). p-values by two-tailed t-test, p = 0.08 compared to control. d Immunofluorescence of CTCF in WT_CTCF and MUT_CTCF. Scale bar was 5 μm. This experiment was performed three times, with similar results. e MA plot of CTCF ChIP-seq showing global change of CTCF binding affinity to chromatin in MUT_CTCF mESCs versus WT_CTCF mESCs, FDR < 0.05. f The distribution of all peaks (left) and enhanced peaks of O-GlcNAc-deficient CTCF (right) with indicated genomic features. g Profiling of the chromatin accessibility on enhanced peaks. h Western blot of chromatin-bound CTCF and non-chromatin-bound CTCF in WT_CTCF and MUT_CTCF mESCs. H3 and GAPDH were shown as loading control. These experiments were performed three times, with similar results. i Gene ontology (GO) analysis of enhanced O-GlcNAc-deficient CTCF peaks targeted genes, p-values by Fisher’s Exact test. j Sample of enhanced O-GlcNAc-deficient CTCF peak targeted genes. See also Supplementary Fig. 3. Source data are provided as a Source Data file.

