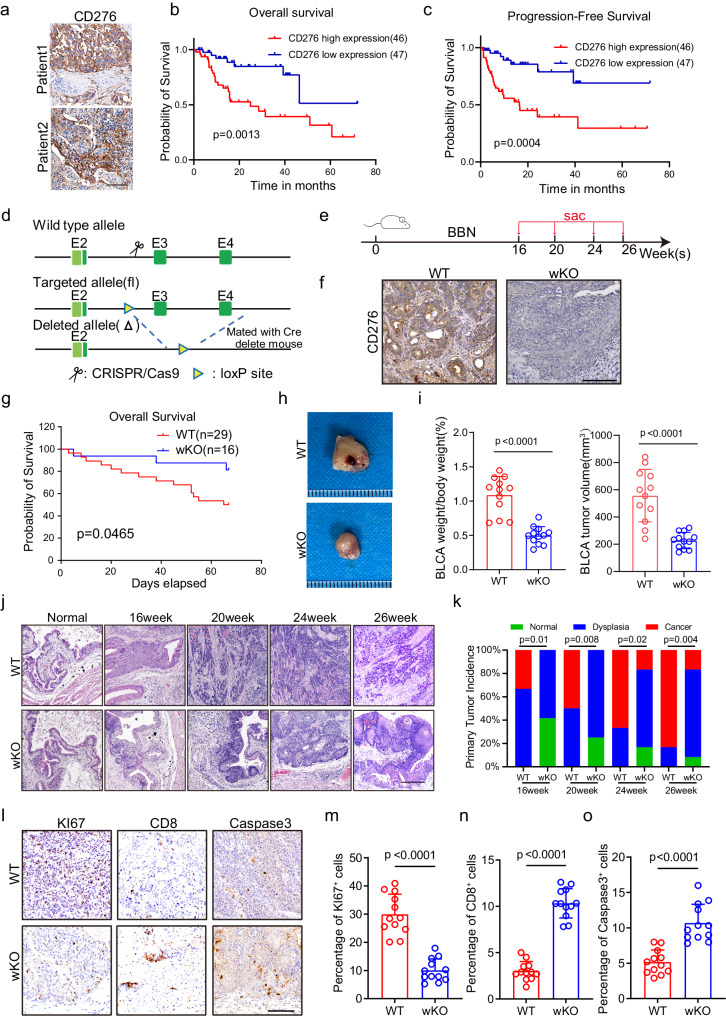
Fig. 1. CD276 is highly expressed in BLCA and global knockout of CD276 can inhibit the progression of BLCA.
a Representative images of CD276 staining of human BLCA tissues from the Fourth Medical Center of PLA General Hospital cohort. Scale bar, 100 μm. b, c Kaplan-Meier survival curves were established by CD276 expression. Patients with BLCA were divided in high and low expression groups based on CD276 expression. Overall survival (OS, b) and progression-free survival (PFS, c) of PLAGH cohort are shown. P values were calculated by log-rank test. d Construction of Cd276 whole-body knockout (wKO) mice. e The experimental design of the bladder cancer tumorigenesis model and the schematic diagram of sample collection in batches. f Representative images of CD276 IHC staining in WT and wKO male mice. Scale bar, 100 μm. g The Kaplan-Meier overall survival curve of WT and wKO male mice. P value was calculated by log-rank test. h Representative image of BBN-induced bladder cancer. i Quantification of BLCA weight to body weight ratio (left) and BLCA tumor volume(right) in WT and wKO male mice. Data are presented as mean ± SD (n = 12). P value was calculated by two-tailed unpaired Student’s t test. Representative images of H&E staining for BLCA at different time points (j) and quantification of primary tumor incidence (k) in WT and wKO male mice. Scale bar, 200 μm. P values were calculated by Pearson chi-square test. Representative IHC staining images (l) and percentages of KI67+ (m), CD8+ (n), and Caspase3+ (Cleaved Caspase3, o) cells in WT and wKO male mice. Scale bar, 100 μm. Data were presented as mean ± SD (n = 12). P values were calculated by two-tailed unpaired Student’s t test.

