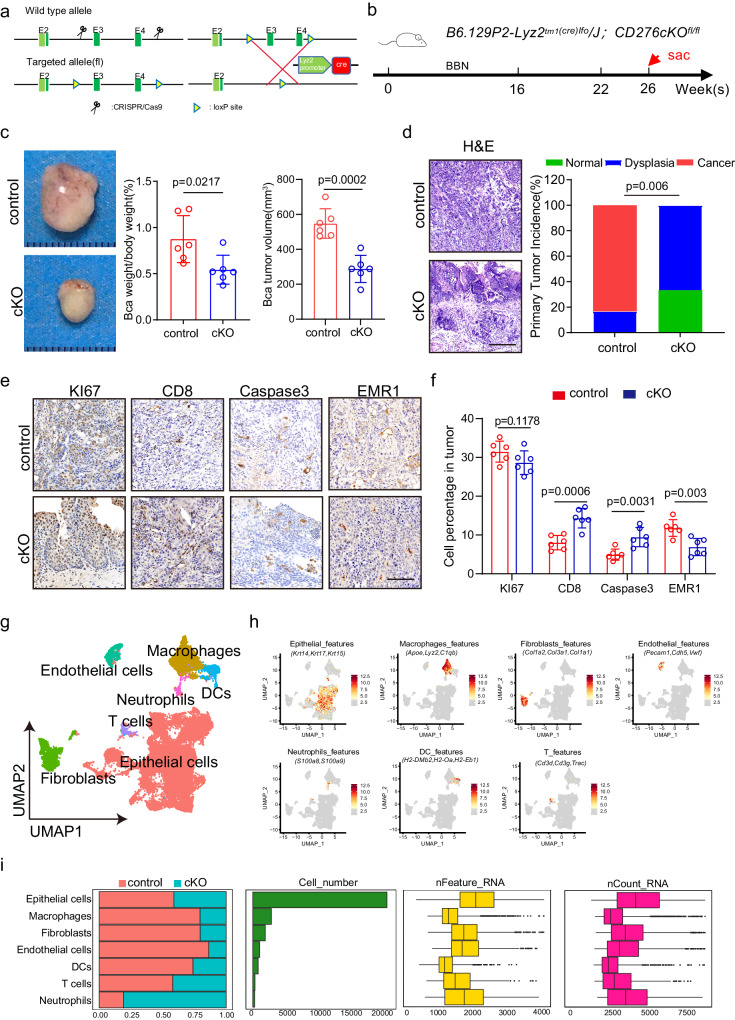
Fig. 3. Depletion of Cd276 in TAMs suppresses the tumorigenesis and remodels landscape of mouse BLCA.
a Construction of Cd276-conditional knockout (cKO) mice. b The experimental design of the bladder cancer tumorigenesis model. c Representative image of BBN-induced bladder cancer. Quantification of BLCA weight to body weight ratio and BLCA tumor volumes in control and cKO male mice. Data are presented as mean ± SD (n = 6). P value was calculated by two-tailed unpaired Student’s t test. d Representative H&E staining of BLCA (left) and quantification of primary tumor incidence (right) in control and cKO male mice. Scale bar, 200 μm. P value was calculated by Pearson chi-square test. Representative images of KI67, CD8, Caspase3, EMR1 IHC staining (e) and percentages of KI67+, CD8+, Caspase3+ and EMR1+ cells (f) in control and cKO male mice. Scale bar, 100 μm. Data are presented as mean ± SD (n = 6). P values were calculated by two-tailed unpaired Student’s t test. g UMAP plot displaying the results after unbiased clustering. Subpopulations of epithelial cells, macrophages, endothelial cells, fibroblasts, neutrophils, DCs and T cells were identified, with each cell type colored. h UMAP plots showing the expression of feature gene sets in all cell type. i Data of the 7 subclusters of 29310 cells from 4 samples (from left to right): bar plots of proportion of cell type by control or cKO, and total cell number and box plots of the number of UMIs and genes.

