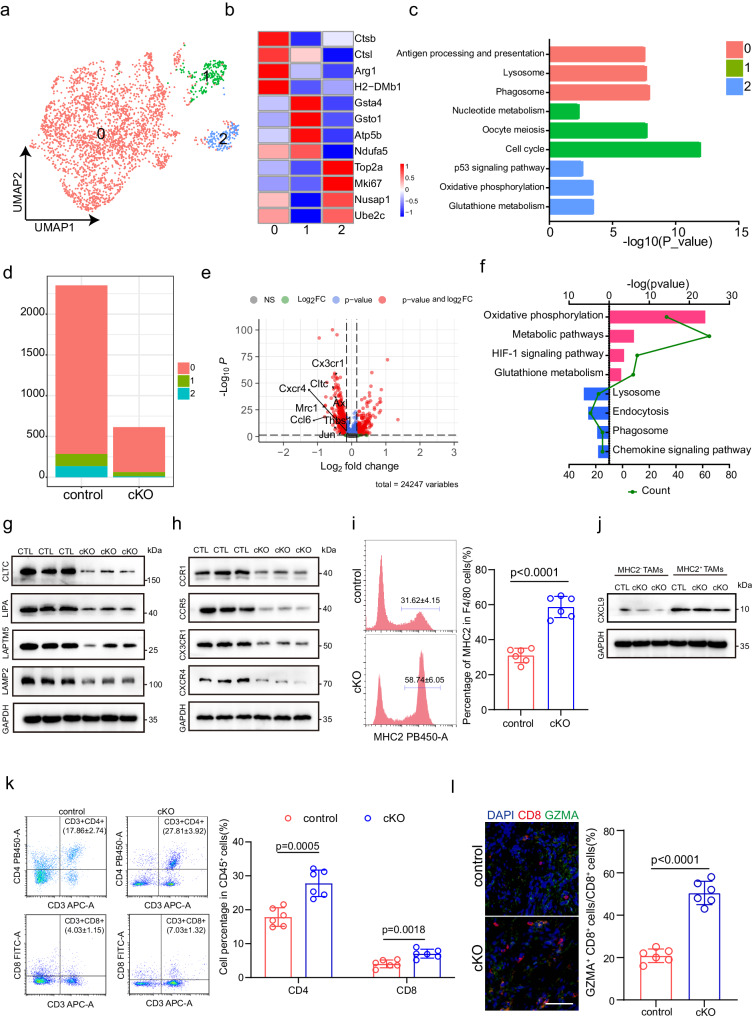
Fig. 4. Depletion of Cd276 in TAMs alters the cellular compositions and gene expression patterns.
a UMAP plot showing 3 clusters of 2967 macrophages (indicated by colors). b Heatmap of signature genes for macrophages clusters. Each cell cluster is represented by four specifically expressed genes. c KEGG pathway enrichment analysis using the characteristic genes of macrophage subpopulation. d Bar plots of number of the subclusters of macrophages in control and cKO male mice. e Volcano plot displaying the −Log10 P vs Log2 fold-change of genes differentially expressed between control and cKO in macrophages. f KEGG pathway enrichment analysis using the intergroup differential gene of macrophages. g Western blot of CLTC, LIPA, LAPTM5 and LAMP2 in macrophages from control and cKO groups using GAPDH as loading control. h Western blot of CCR1, CCR5, CX3CR1 and CXCR4 in macrophages from control and cKO groups using GAPDH as loading control. i Representative flow cytometry plots (left) and statistical analysis of MHCII+ macrophages (right) in control and cKO groups. Data are presented as mean ± SD (n = 6). P value was calculated by two-tailed unpaired Student’s t test. j Western blot of CXCL9 in MHCII+ TAMs and MHCII- TAMs using GAPDH as loading control. k Representative flow cytometry plots (left) and statistical analysis of CD3+CD4+ T cells and CD3+CD8+ cells (right) in control and cKO groups. Data are presented as mean ± SD (n = 6). P value was calculated by two-tailed unpaired Student’s t test. l Representative immunofluorescence (IF) staining images of CD8 (red) and GZMA (green, right). Statistical analysis of the ratio of CD8+ GZMA+ cells to CD8+ cells (CD8T killing capacity) in control and cKO male mice (left). Scale bar, 50 μm. Data are expressed as mean ± SD (n = 6). P values were calculated by two-tailed unpaired Student’s t test.

