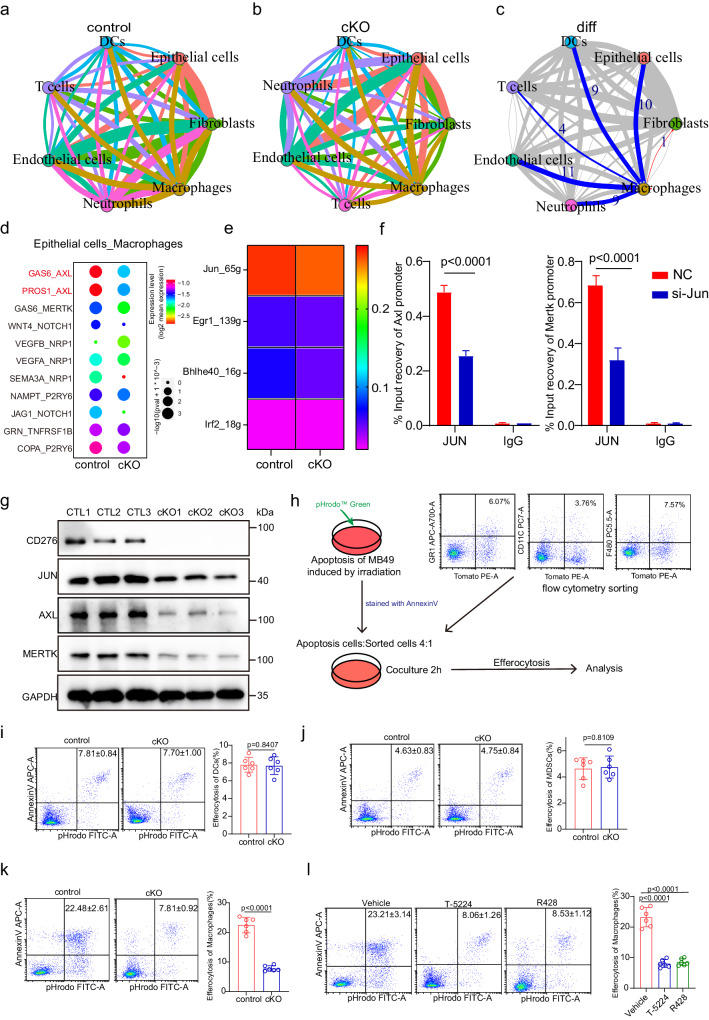
Fig. 5. CD276 promotes efferocytosis by regulating expression of AXL/MerTK.
CellphoneDB results showing the capacity of intercellular communication in control (a) and cKO (b) BLCA tissues (the width of the line is determined by the number of interactions between cell types and the color of the line is determined by the transmitter). c Network plot showing the difference in the capacity of intercellular communication between control and cKO BLCA tissues (blue line represents downregulation of intercellular communication, red represents upregulation, and the width of the line represents the number of up- or down-regulations). d Dot plot showing the expression of receptor-ligand pairs between macrophages and epithelial cells in control and cKO BLCA tissues (colors represent mean expression of receptors and ligands). e Heatmap showing the activity of TFs in macrophages from control and cKO male mice. f ChIP-qPCR analysis of JUN binding to Axl and Mertk genes. Data are presented as mean ± SD (n = 3). P values were calculated by two-tailed unpaired Student’s t test. g Western blotting of CD276, JUN, AXL, MERTK and GAPDH in control and cKO BLCA macrophages. h Flow chart of efferocytosis. The apoptotic cells induced by irradiation were co cultured with the sorted cells for 2 h and then analyzed by flow cytometry. Representative flow cytometry plots and quantification of percentage efferocytosis in DCs (i), MDSCs (j) and macrophages (k) from control and cKO male mice. Data presented as mean ± SD (n = 6). P values were calculated by two-tailed unpaired Student’s t test. l Representative flow cytometry plots of tumor (left) and quantification of percentages of efferocytosis in macrophages of different treatment groups (right). Data was shown as mean ± SD (n = 6). P value presented by one-way ANOVA with Tukey’s multiple comparison test.

