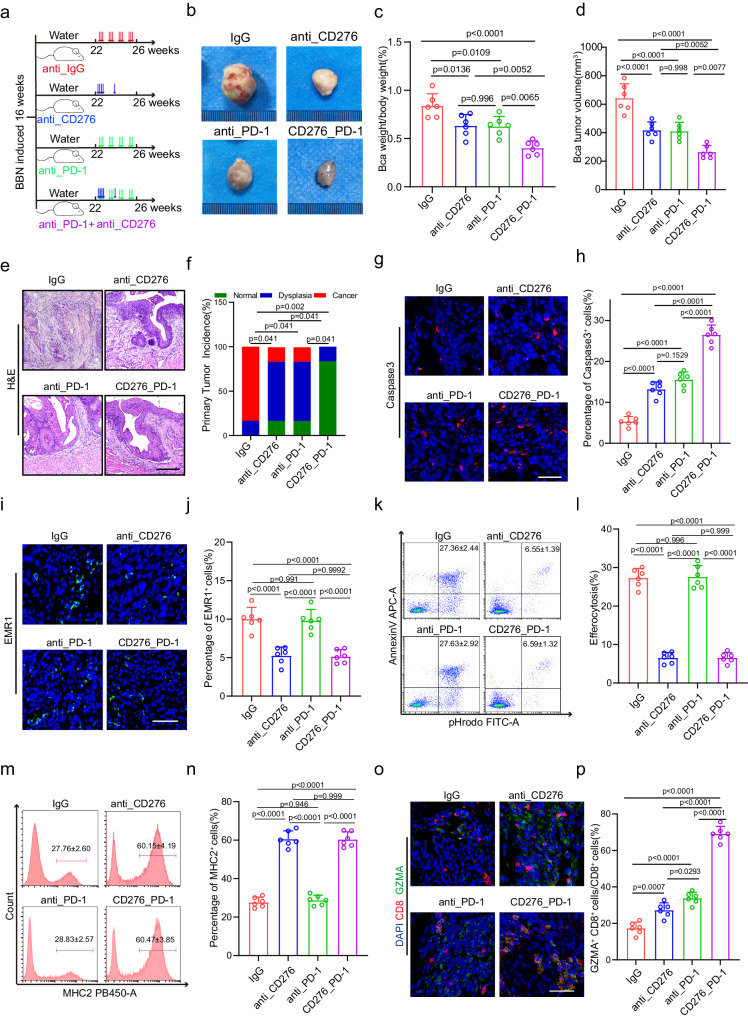
Fig. 7. CD276 enhances anti-PD-1-induced tumor regression.
a The experimental design of the bladder cancer tumorigenesis model and different strategies of treatment. The male mice were treated with either anti-CD276 antibody (10 mg/kg body weight, 3 times a week) with or without PD-1 antibody (200 µg/mouse, day1, 3, 5, 7, 14) as indicated starting from week 22. b−d Representative image of BBN-induced bladder carcinoma in male mice (b). Quantification of the ratio of BLCA weight to body weight (c) and BLCA tumor volume (d) in the different treatment groups. Data are presented as mean ± SD (n = 6). P values were presented by one-way ANOVA with Tukey’s multiple comparison test. Representative H&E staining of BLCA (e) and quantification of primary tumor incidence (f) in different treatment groups. Scale bar, 200 μm. P values were calculated by Pearson chi-square test. g−j Representative Immunofluorescence (IF) staining images of Caspase3 (g) and EMR1 (i). Quantification of percentages of Caspase3+ (h) and EMR1+ (j) cells in different treatment groups. Scale bar, 50 μm. Data was shown as mean ± SD (n = 6). P values were presented by one-way ANOVA with Tukey’s multiple comparison test. Representative flow cytometry plots (k, m) and quantification of the percentages of efferocytosis (l) and percentages of MHCII+ cells (antigen presenting ability of macrophages, n) in macrophages of different treatment groups. Data was shown as mean ± SD (n = 6). P values were presented by one-way ANOVA with Tukey’s multiple comparison test. o, p Representative Immunofluorescence (IF) staining images of CD8 (red) and GZMA (green, o). Statistical analysis of the radios of CD8+ GZMA+ cells to CD8+ cells (p) in different treatment groups. Scale bar, 50 μm. Data are shown as mean ± SD (n = 6). P values were presented by one-way ANOVA with Tukey’s multiple comparison test.

