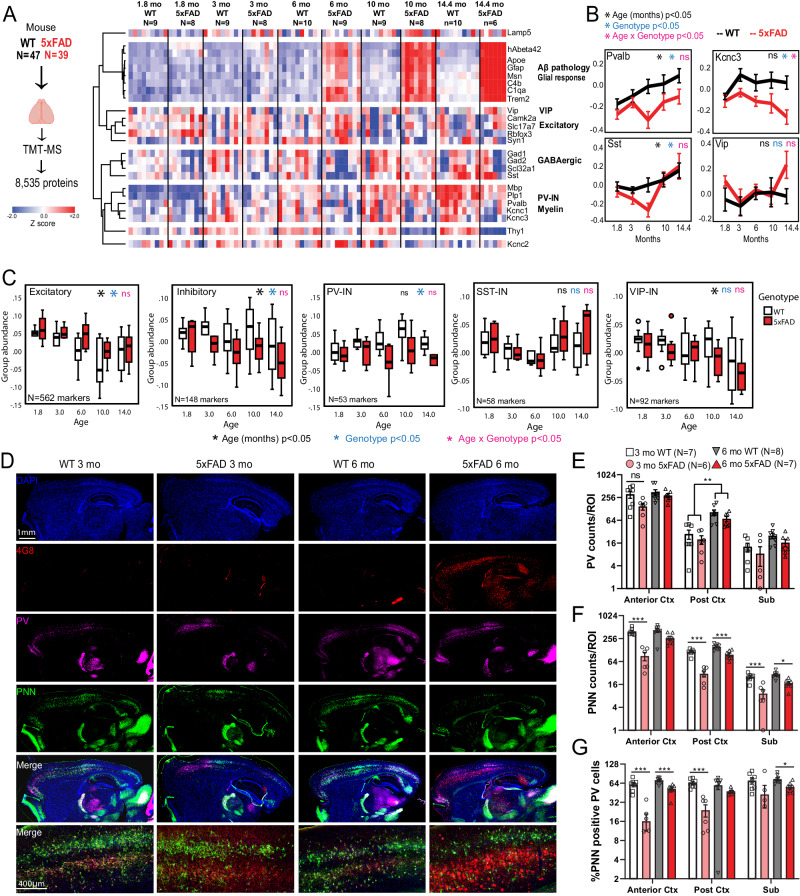
Fig. 4. Bulk tissue proteomics of mouse brain reveals differential effects of Aβ pathology and aging on PV-INs and their peri-neuronal nets.
A Study outline for analysis of mouse bulk brain (cortex) TMT-MS proteomics data. 8,535 proteins were quantified by TMT-MS from 47 WT and 39 5xFAD mouse brains. From these, selected proteins reflective of Aβ pathology (hAβ42 peptide), were visualized as a heatmap after hierarchical clustering based on protein IDs (N/group for panels A–C are indicated). B Trajectories of change in levels of PV-IN proteins (Pvalb, Kcnc3), SST-IN (Sst) and VIP-IN (Vip) based on age and genotype. Error bars represent SEM. Statistical tests included linear regression analyses with age, genotype and ‘age x genotype’ interaction terms as covariates. Levels of significance of each are indicated. C Trajectories of change in overall levels of pan-excitatory, pan-inhibitory, as well as PV-IN, SST-IN, and VIP-IN proteins, based on age and genotype. We used lists of transcriptomic markers of these classes of neurons (from sc/snRNAseq datasets) that were at least 4-fold enriched in the class of interest over all other neuronal types. After normalizing and z-transforming proteomic data, neuronal class-based group abundance scores were calculated and compared across ages and genotypes. Linear regression analyses were performed using age, genotype and age x genotype interaction term as covariates. Levels of significance of each, are indicated (Box plots: Median, inter-quartile range, min and max are shown). D Representative images from immunofluorescence microscopy studies of mouse brain (sagittal sections, WT and 5xFAD, ages 3 and 6 months, animals used for TMT-MS studies in A), to detect PV-INs (Pvalb protein), perineuronal nets (WFA lectin), Aβ pathology (4G8) and DAPI. 4x tiled images and 20x images from cortex are shown. E–G Quantitative analysis of Pvalb protein, PNNs, and proportion of Pvalb+ INs that have PNNs in the cortex and subiculum of WT and 5xFAD mice at 3- and 6- mo of age. Y-axes are log2 transformed. Error bars represent SEM (Post-hoc Tukey HSD pairwise comparisons; *p < 0.05, **p < 0.01, ***p < 0.005). See Supplementary Fig. 5 and Supplementary Data 4. Source data are provided as a Source Data file. Image was created using BioRender.com.

