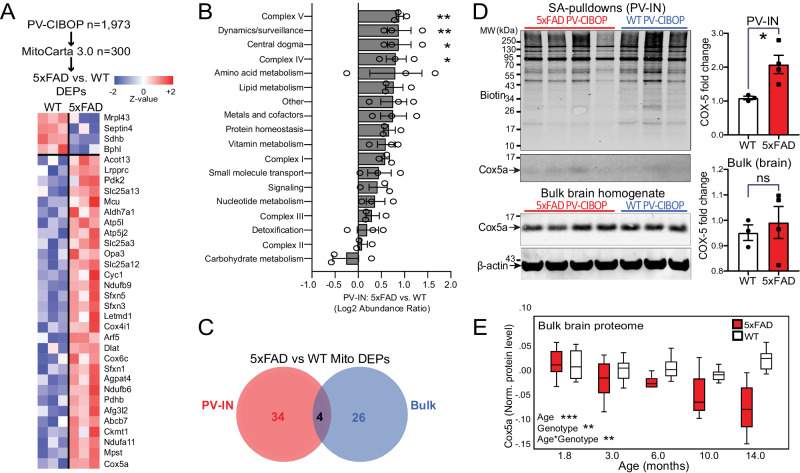
Fig. 7. Distinct mitochondrial alterations in PV-INs at early stages of Aβ pathology.
A Heatmap representation of mitochondria-localized proteins that were also identified as DEPs comparing 5xFAD to WT PV-IN proteomes. B Differential abundance analysis of distinct mitochondrial functional groups, comparing 5xFAD to WT PV-IN proteomes. The 300 mitochondrial proteins identified in PV-INs were categorized based on known functional and localization-related annotations (from MitoCarta 3.0). Protein levels were normalized and them group-wise abundances were estimated and compared across WT and 5xFAD genotypes (n = 3 (WT), 4 (5xFAD) *p < 0.05, **p < 0.01 for unpaired two-tailed T-test, error bars represent SEM). C. Venn diagram of mitochondrial proteins that were identified as DEPs in either PV-IN proteomes or bulk brain cortical proteomes, comparing 5xFAD and WT mice. Minimal overlap in DEPs were observed, highlighting unique mitochondrial effects of Aβ pathology in PV-INs, not visible at the bulk tissue level. D WB verification of increased Cox5a protein levels in PV-INs in 5xFAD as compared to WT mice. SA-enriched pulldowns were independently performed from samples used for LFQ-MS studies. Cox5a protein band intensity was normalized to total biotinylation signal in the SA-enriched pulldowns, and to beta-actin in the bulk brain homogenates, and then compared across genotype (5xFAD vs. WT) (n = 3 (WT), 4 (5xFAD); Data shown as mean ± SEM; *p < 0.05, unpaired two-tailed T-test). E Cox5a protein levels, quantified by TMT-MS, from an independent set of cortical brain homogenates obtained from WT and 5xFAD mice (from Fig. 4). Using linear regression modeling, age, genotype and age x genotype interaction terms were tested for associations with Cox5a protein levels. As compared to WT brain where Cox5a levels were relatively constant with aging, Cox5a levels in 5xFAD brain showed age-dependent decrease after 6 months of age. This pattern was discordant with increased Cox5a in PV-INs in 5xFAD mice at 3 months. *p < 0.05, **p < 0.01, ***p < 0.005). Source data are provided as a Source Data file.

