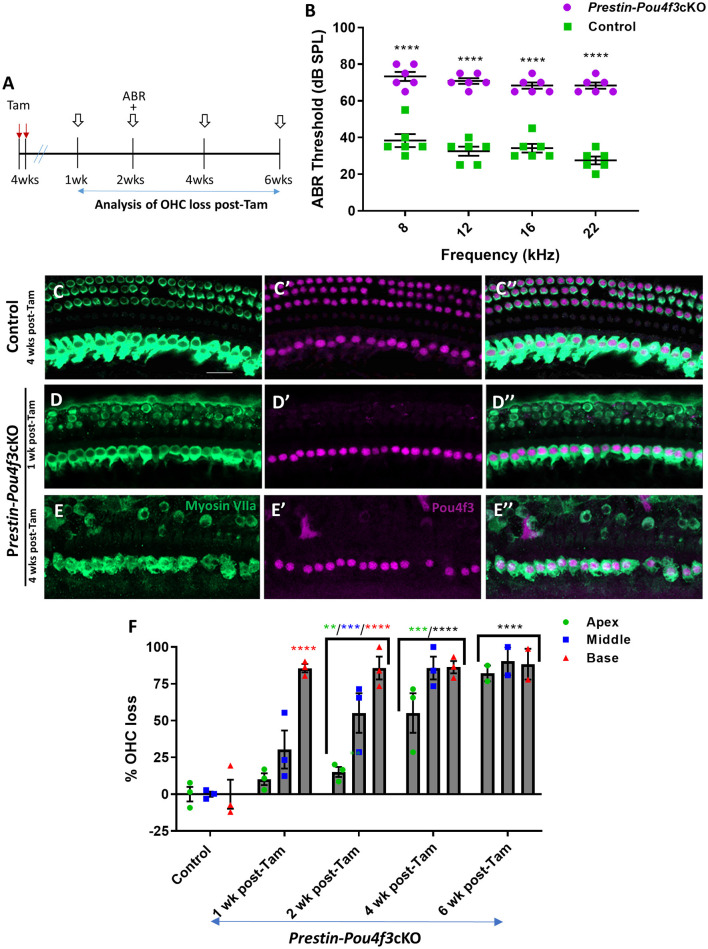
Figure 3.
Pou4f3 deletion from OHCs once hearing is mature causes elevated ABR thresholds and progressive OHC loss. (A) Schematic for the experimental design using Prestin-Pou4f3cKO mice to delete Pou4f3 from OHCs at 4 weeks (wks) of age. Open arrows indicate post-tamoxifen (post-Tam) timepoints when OHC loss was assessed. (B) At 2 weeks after Pou4f3 deletion, there was a significant elevation in ABR thresholds in Prestin-Pou4f3cKO mice compared to their control littermates at all frequencies tested [N = 6; significant main effect of genotype, F(1,10) = 355.2, p < 0.0001 and frequency F(3,30) = 4.539, p = 0.0097]. Asterisks indicate comparisons between genotypes at each frequency based on a Bonferroni-corrected post-hoc test. (C–E″) Representative confocal images from control (C–C″) and Prestin-Pou4f3cKO (D–E″) cochleae. HCs in the control cochleae and IHCs in the Prestin-Pou4f3cKO cochleae remained intact (myosin VIIa, green) and had nuclear expression of POU4F3 (magenta). Analysis at 1 and 4 weeks after Pou4f3 deletion showed progressive loss of OHCs in Prestin-Pou4f3cKO cochleae over time. (F) Quantification of OHC loss in control and Prestin-Pou4f3cKO cochleae (N = 3) between 1 and 6 weeks post-Tam. There was a significant main effect of time [F(4,9) =38.51, p < 0.0001]; cochlear turn [F(2,18) = 25.62, p < 0.0001]; and an interaction between time and cochlear turn [F(8,18) = 5.625, p = 0.0011]. Differences from control within each cochlear turn are indicated by the asterisks based on a Tukey's-corrected post-hoc test. Green asterisks are p values for the apical turn, blue asterisks are p values for the middle turn, and red asterisks are p values for the basal turn. Black asterisks were used when the p value was the same for two or three turns. Data are presented as mean ± SEM. **p < 0.01, ***p < 0.001 and ****p < 0.0001. Comparisons across time post-Tam and across cochlear turns within the same genotype are presented in Supplementary Table 4. Scale bar =20 μm.

