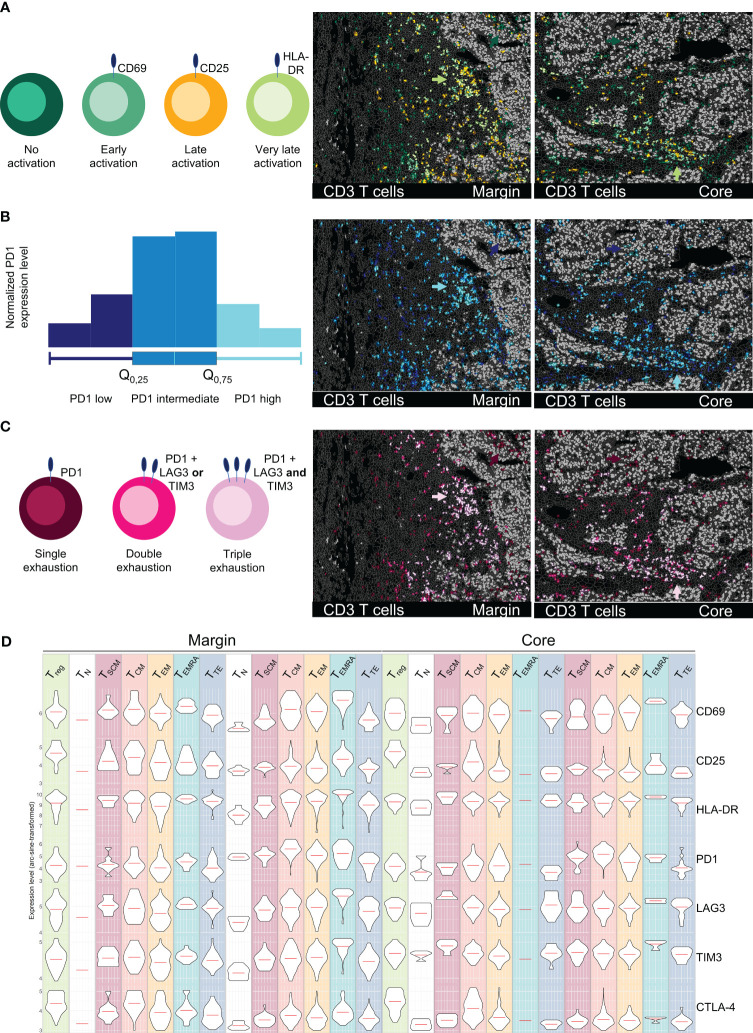
Figure 6.
Spatial profiling of T cell activation and exhaustion states in an HCC sample. All images depict tumor margin (left) and tumor core (right). (A) Activation status of T cells subsets (CD69 = early, CD25 = late, HLA-DR = very late). (B) PD1 marker expression on T cells, categorized as low (0-25%), intermediate (25-75%), and high (75-100%). (C) Exhaustion levels of T cells based on the expression of PD1 (single exhaustion), PD1 plus TIM3 or LAG3 (double exhaustion), or PD1 plus TIM3 and LAG3 (triple exhaustion). Arrowheads in (A–C) highlight the ITM-proximal immune cell cluster in tumor margin and core. (D) Representation of activation/exhaustion markers for T cells (CD69, CD25, HLA-DR, PD1, LAG3, TIM3, CTLA4) as violin plots for T cell activation/exhaustion subsets. Depicted markers and annotated cell types as indicated by the color code. ROI sizes: Tumor margin (ROI15) and tumor core (ROI16): 975 x 769 µm.

