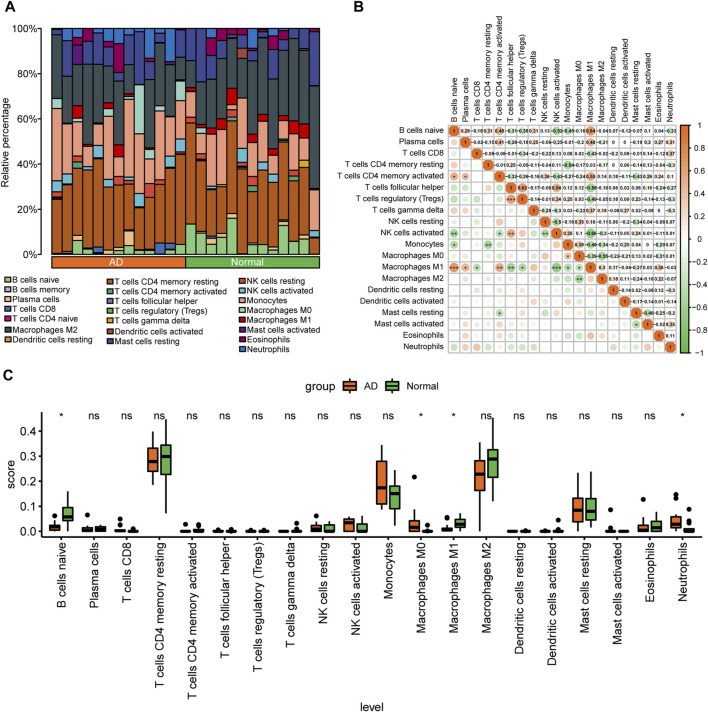
FIGURE 4.
Analysis of immune cell infiltration in the combined aortic dissection (AD) dataset of GSE153434 and GSE107844. (A) Bar graphs of 22 immune cell types stacked in different samples of the combined dataset, with different colored long bars representing different immune cells. (B) Correlation analysis between various immune cells in the dataset. The color represents the correlation strength, with darker orange indicating a stronger correlation. (C) Differences in the abundance of enrichment of 20 immune cells in the dataset; green indicates the control group, orange indicates the AD group, the horizontal axis indicates the 20 immune cells, and the vertical axis indicates the abundance of immune cell infiltration. (ns: p > 0.05, *: p < 0.05, **: p < 0.01, ***: p < 0.001, ****: p < 0.0001).

