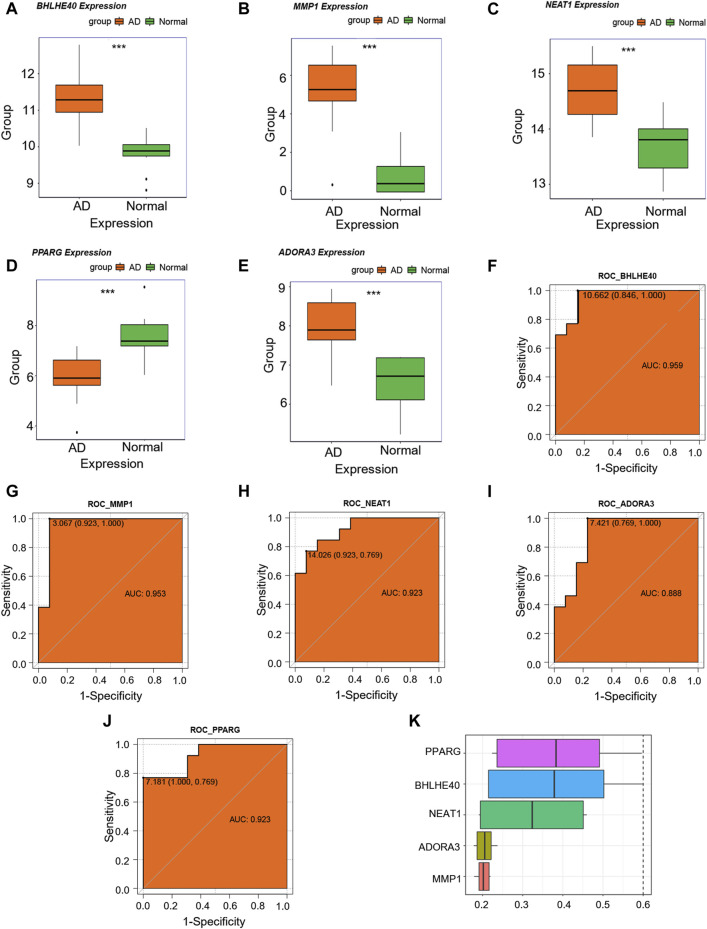
FIGURE 7.
Key genes analysis. (A–E) Differences in expression levels of BHLHE40 (A), MMP1 (B), NEAT1 (C), PPARG (D), and ADORA3 © in the control (green) and aortic dissection (AD, orange). (F–J) Receiver operating characteristic (ROC) curves for BHLHE40 (F), MMP1 (G), NEAT1 (H), ADORA3 (I), and PPARG (J). The horizontal coordinate is 1—specificity and the vertical coordinate is sensitivity. AUC, area under the curve. (K) Functional similarity analysis of key genes. (ns: p > 0.05, *: p < 0.05, **: p < 0.01, ***: p < 0.001, ****: p < 0.0001); the closer the AUC of the ROC curve is to 1, the better the diagnosis prediction (AUC of 0.5–0.7 indicates low accuracy, AUC of 0.7–0.9 indicates moderate accuracy, and AUC > 0.9 indicates high accuracy).

