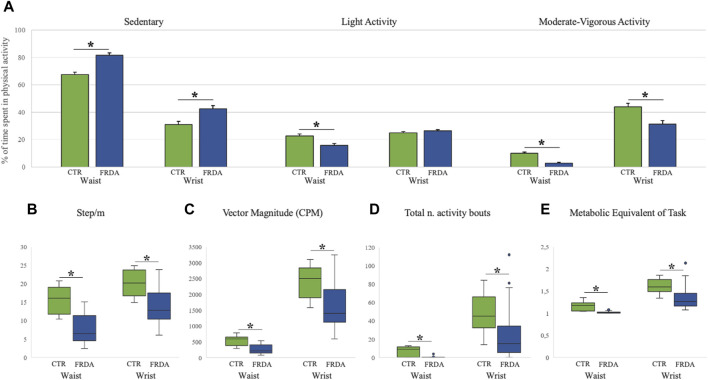
FIGURE 1.
Baseline Actigraph measures in patients with Friedreich ataxia and in healthy controls Measures of physical activity in patients with Friedreich ataxia (FRDA, blue columns) and in controls (CTR, green columns) are reported for both wrist- and waist-worn sensors. Panel (A) shows the percentages of sedentary, light and moderate-vigorous activities (mean, standard error). Panels (B–E) display box and whisker plots of accelerometer data for: Step/minute [graph (B)]; Vector Magnitude over 3 axes [graph (C)]; total number of activity bouts [graph (D)]; and metabolic equivalent of task rate [graph (E)]. Boxes show median value (middle line) and inter-quartile range (25%–75%), whiskers extend to upper and lower quartiles, dots represent outliers. *p < 0.05 for comparison between FRDA and controls (after Bonferroni correction).

