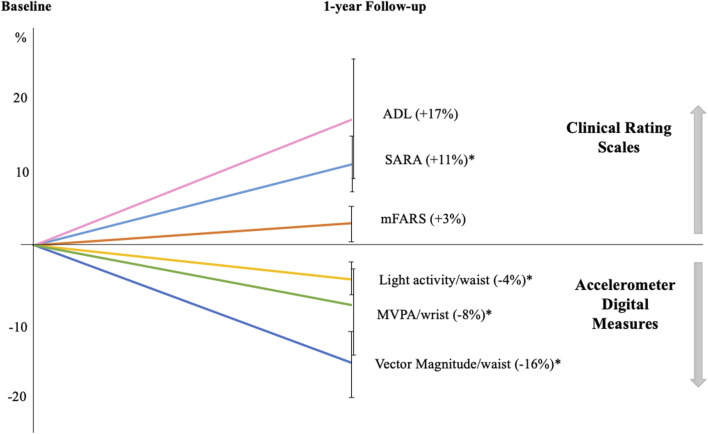
FIGURE 2.
One-year longitudinal changes in Friedreich patients Graph displays the percentages of variations in clinical and digital measures at follow-up compared to baseline. All clinical scale scores increased at follow-up indicating a worsening of ataxia severity: SARA (Scale for the Assessment and Rating of Ataxia); mFARS (modified Friedreich Ataxia Rating Scale); and ADL (Activity of Daily Living part II of FARS scale). Accelerometer digital measures showed a reduction in daily-life motor activities, as indicated by the decreased percentage of light and moderate-vigorous activities (MVPA) and in vector magnitude. Error bars indicate standard error; *p < 0.05 at paired-statistical test comparing follow-up and baseline data for.

