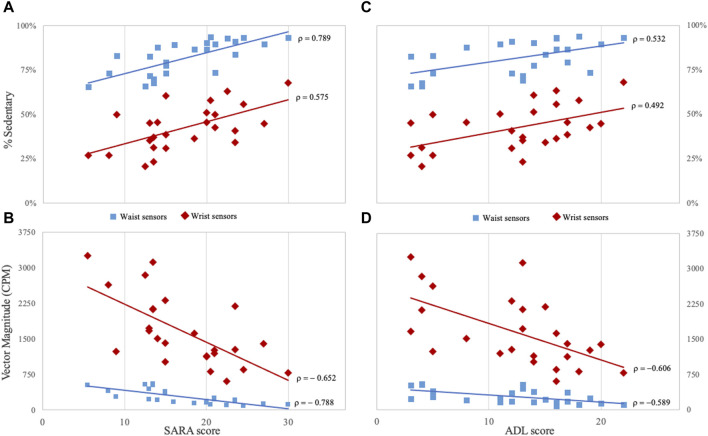
FIGURE 3.
Correlations between clinical and digital measures in Friedreich patients (A, B) panels show the correlation between SARA score and the percentage of time spent in sedentary activities and Vector Magnitude. (C, D) panels show the correlation between ADL score and the same digital measures. Measures derived from for waist sensors are indicated by light-blue squared dots, and measures from wrist sensors by red rhombuses. CPM: counts per minute; SARA: Scale for the Assessment and Rating of Ataxia; ADL: Activity of Daily Living part II of Friedreich Ataxia Rating Scale. All correlations are statistically significant (p < 0.05) after Bonferroni correction for multiple comparisons.

