Figure 3.
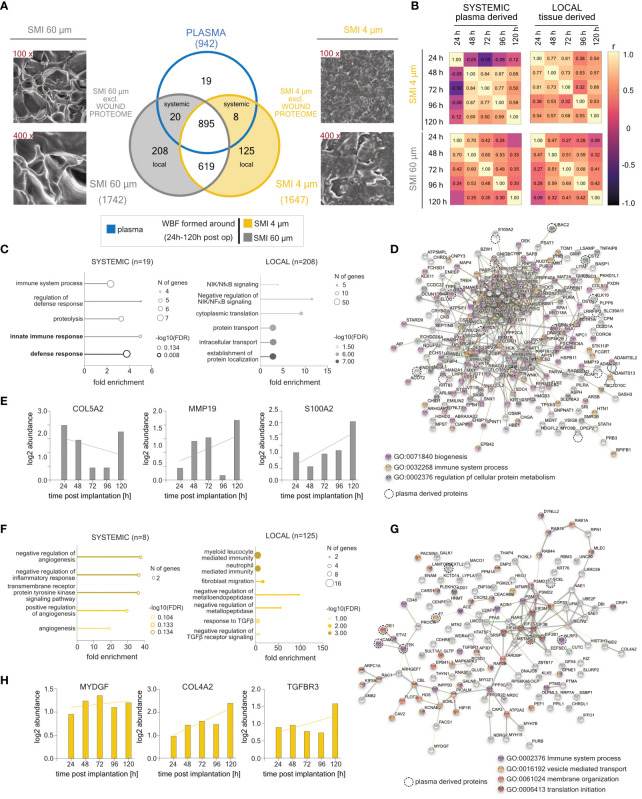
SMI surface topography-exclusive plasma- and local tissue-derived wound bed fluid proteome formed intra-individually around SMI 4 µm and SMI 60 µm post-implantation (24 – 120 h post-op; n=7). (A) SEM image of SMI 4 µm and SMI 60 µm surface (magnitude: 100x and 400x) and Venn diagram showing the distribution of proteins in the collected plasma (pre-op) and WBF formed intraindividual around both tissue expanders (24 – 120 h post-op). Shaded grey panel: SMI 60 µm Ra exclusive plasma- and local tissue-derived wound proteome found in plasma and WBF around both devices. Shaded yellow panel: SMI 4 µm Ra exclusive plasma- and local tissue-derived wound proteome found in WBF around both devices but NOT in plasma. (B) Heatmap of correlation matrix showing Pearson r correlation of log2 protein abundance in SMI surface topography-exclusive plasma- and local tissue-derived WBF samples over time. The r value for every pair was denoted in corresponding square units. GO biological process enrichment of systemic and local (C) SMI 60 µm and (F) SMI 4 µm exclusive wound proteome. Protein-protein interaction regulatory network based on STRING database of (D) SMI 60 µm and (G) SMI 4 µm exclusive wound proteome. Time course-dependent protein abundance of fibrosis markers enriched exclusively around (E) SMI 60 µm or (G) SMI 4 µm. dashed circle: plasma-derived proteins The level for statistical significance was set at nsp>0.05, for all statistical tests (inter- and intra-individual comparison; n=7).

