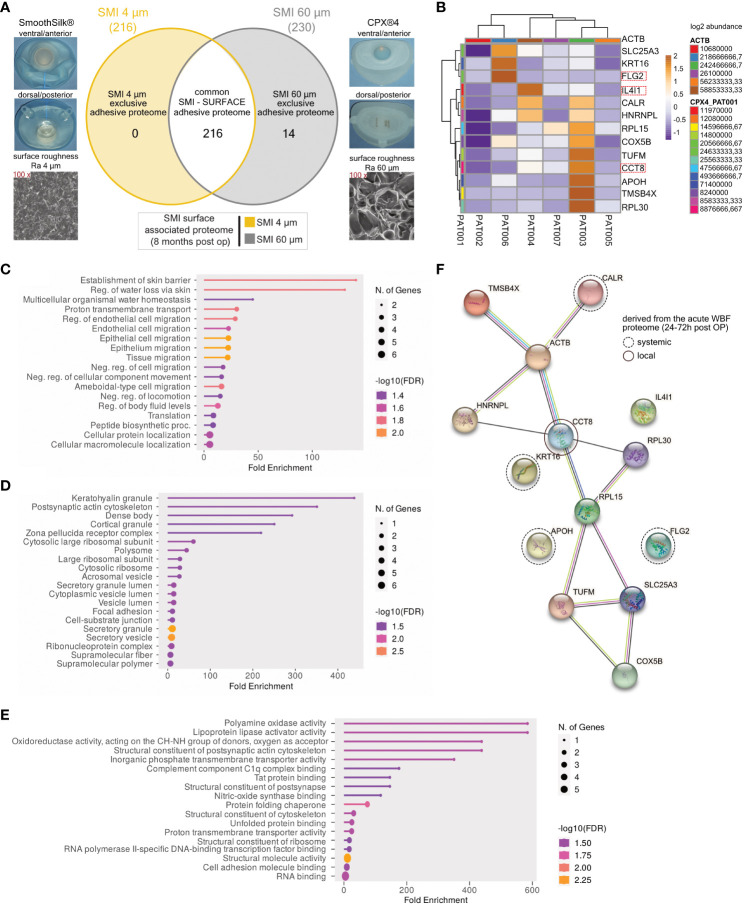
Figure 5.
SMI topography affects surface-associated adhesive proteome. (A) Photo and SEM image of SMI 4 µm and SMI 60 µm and Venn diagram showing the distribution of proteins associated at silicone tissue expander surface, of both SMI 4 µm and SMI 60 µm (6 – 8 months post-op; n=7). Shaded yellow panel: SMI 4 µm surface exclusive adhesive proteome. Shaded grey panel: SMI 60 µm surface exclusive adhesive proteome. Clear panel: common adhesive proteome to both SMI. (B) Heatmap analysis of mean protein log2 transformed abundance of SMI 60 µm surface exclusive adhesive proteome. Rows: Clustered by Manhattan distance, average method, and tightest cluster first tree ordering. Columns: Clustered by correlation distance, average method, and tightest cluster first tree ordering. (C) GO biological process enrichment, (D) GO molecular function enrichment, (E) GO cellular component enrichment (F) protein-protein interaction regulatory network by K-means clustering based on STRING database, analysis of SMI 60 µm surface exclusive adhesive proteome (inter- and intra-individual comparison; n=7).

