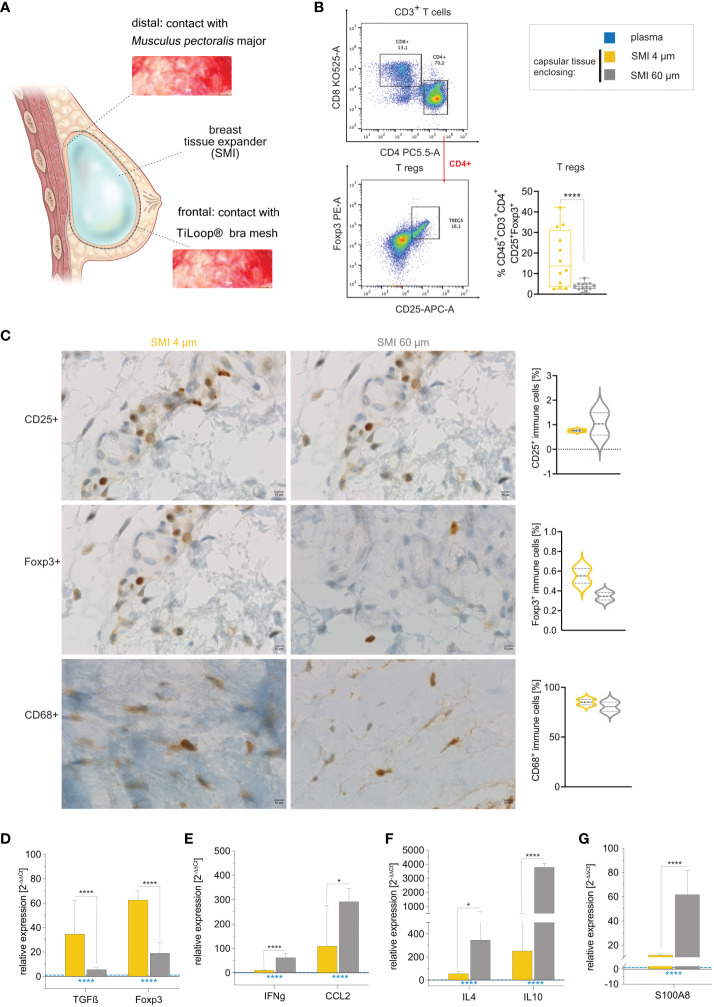
Figure 6.
Reduction of SMI surface roughness from 60 to 4 µm tones down the FBR 6-8 months post-implantation. (A) Schematic representation of capsular tissue sample collection 6-8 months post-op at two different locations, frontal contact zone with the ® Bra mesh and distal contact zone with M. pectoralis major. (B) Flow cytometry revealed a significantly higher intracapsular CD4+ Treg population in capsular tissue formed around SMI 60 µm compared to SMI 4 µm. (C) Immunohistochemical staining of capsular tissue samples, harvested from encapsulated SMI 4 µm and SMI 60 µm for the Treg marker CD25 (panel 1) and Foxp3+ protein (panel 2) as well as macrophage marker CD68 protein (panel 3). Immune cells (brown) and negative stroma cells (blue). 100x magnification (scale 10 µm). (D–G) Intracapsular gene expression of (D) Treg (TGFß and Foxp3) - (E) M1 macrophage (IFNγ and CCL2) - and (F) M2 macrophage (IL4 and IL10) – regulators and (G) fibrosis driver S1008 was evaluated by qPCR analysis. Unpaired t-test by two-stage linear step-up procedure of Benjamini, Krieger and Yekutieli: (D) *p[TGFß] = 0.016155; ****p[Foxp3] <0.000001, (F) ****p[IFNγ] = 0.000007; *p[CCL2] = 0.0182274, (G) *p[IL4] = 0.01723; ****p[IL10] <0.000001 and (I) ****p[S100A8] = 0.000022. The level for statistical significance was set at nsp>0.05, *p<0.05, **p<0.002, ***p<0.0002, and ****p<0.0001, for all statistical tests (inter- and intra-individual comparison; n=7).

