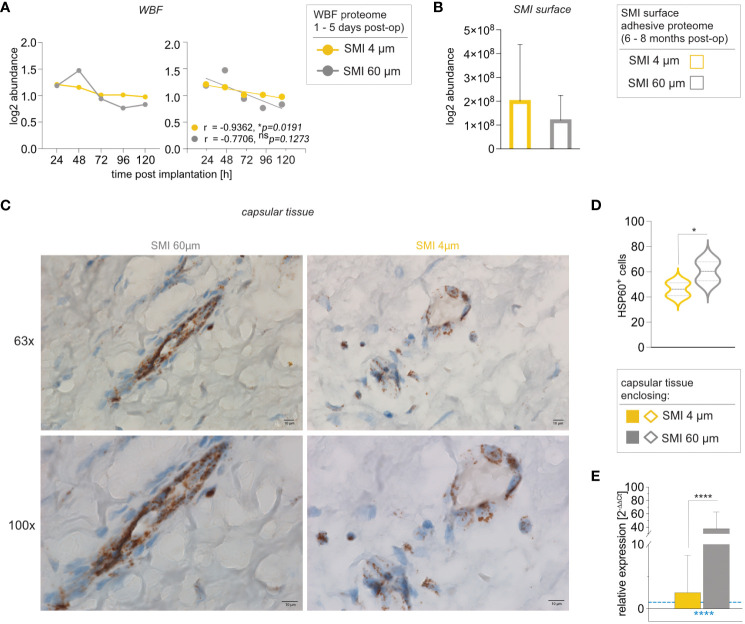
Figure 7.
Reduction of SMI surface roughness from 60 to 4 µm decreases intracapsular HSP60 expression. Comparative analysis of (A) local tissue-derived HSPD1 log2 abundance (Left; dots with connecting lines, median shown) with calculated Pearson r of protein abundance x time point post-op (Right; scatterplot with simple regression line; Pearson r and p-value for both SMI were denoted above the corresponding panel): in WBF formed around both SMI 24 – 120 h post-implantation, (B) SMI surface-associated HSPD1 log2 abundance around both devices and (C, D) Immunohistochemical staining for HSP60 in capsular tissue samples, harvested from encapsulated SMI 4 µm and SMI 60 µm 6-8 months post-implantation (n=5 x two locations of sample isolation). (C) Cells expressing HSP60 antigenic determinants are stained brown and negative stroma cells are blue. Horizontal panel 1: 63x magnification (scale 10 µm) and panel 2: 100x magnification (scale 10 µm) (D) Statistical analysis of cells expressing HSP60 antigenic determinants: 2-way ANOVA of interaction (topography x location of sample isolation) main effect: F (1, 14) = 0.1763, nsp = 0.6810; topography main effect: F(1,14) = 5.777, *p =0.0307; location of sample isolation main effect: F(1,14) = 4.508, nsp = 0.0521. (inter- and intra-individual comparison; n=5; two locations of sample isolation) (E) Intracapsular HSP60 gene expression in capsular tissue samples, harvested from encapsulated SMI 4 µm and SMI 60 µm 6-8 months post-implantation. Unpaired t-test by a two-stage linear step-up procedure of Benjamini, Krieger, and Yekutieli: **p[HSP60] = 0.003143. The level for statistical significance was set at nsp >0.05, *p<0.05, **p<0.002, ***p<0.0002, and ****p<0.0001, for all statistical tests (inter- and intra-individual comparison; n=7).

