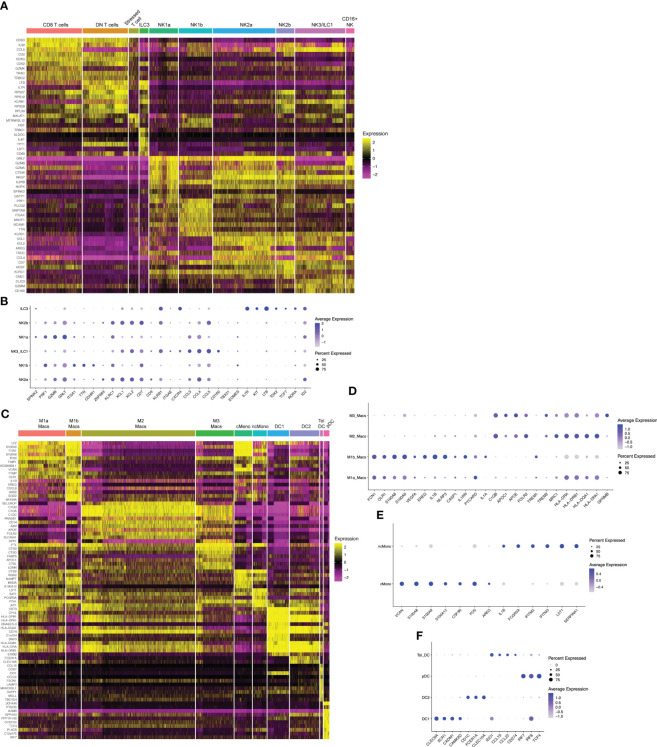
Figure 2.
Hallmark genes of immune subclusters in the combined window of implantation endometrium and first-trimester decidua. Heatmap visualizations of cluster-defining genes across subclusters of (A) lymphocytes and (C) myeloid cells. Additional dot plot visualizations (B, D–F) of selected genes and subclusters are shown. Size of the dots indicates percent of total cells in each subcluster that express the indicated genes. Color of the dots correlates to the average level of expression of the indicated genes. B cells, mast cells, and fibroblasts are not shown due to these being rare cells in our dataset.

