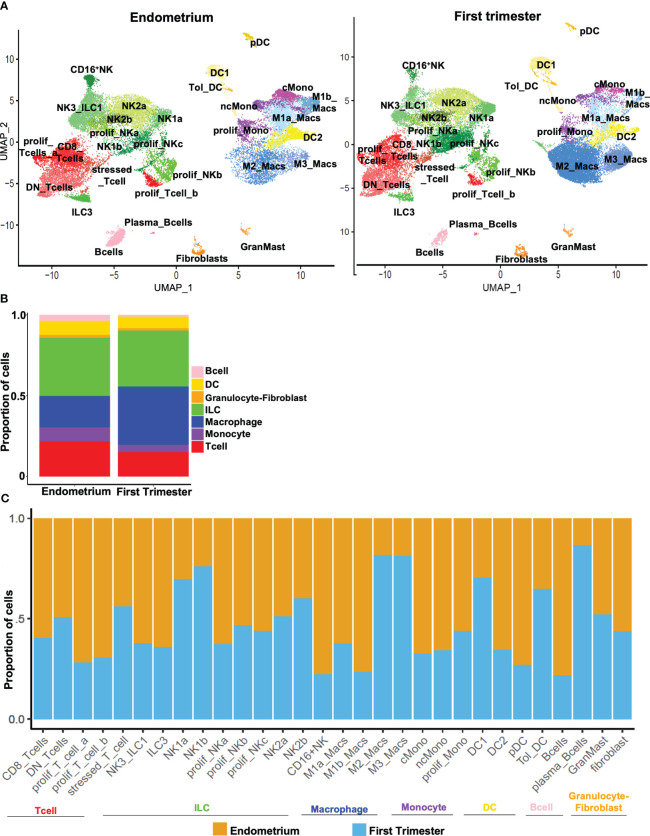
Figure 3.
Dynamic changes in subpopulations of immune superclusters and subclusters in response to embryo implantation. (A) UMAP plots showing subclustering of CD45+ cells meeting quality metrics, recovered from mid-secretory endometrium (left) and first trimester decidua (right). ILC, innate lymphoid cells. (B) Stacked bar charts showing proportion of total CD45+ cells represented by indicated superclusters in pre-implantation endometrium and first trimester decidua. (C) Stacked bar charts showing proportion of total cells in indicated subcluster (x-axis) recovered from endometrium (orange bars) or first trimester decidua (blue bars).

