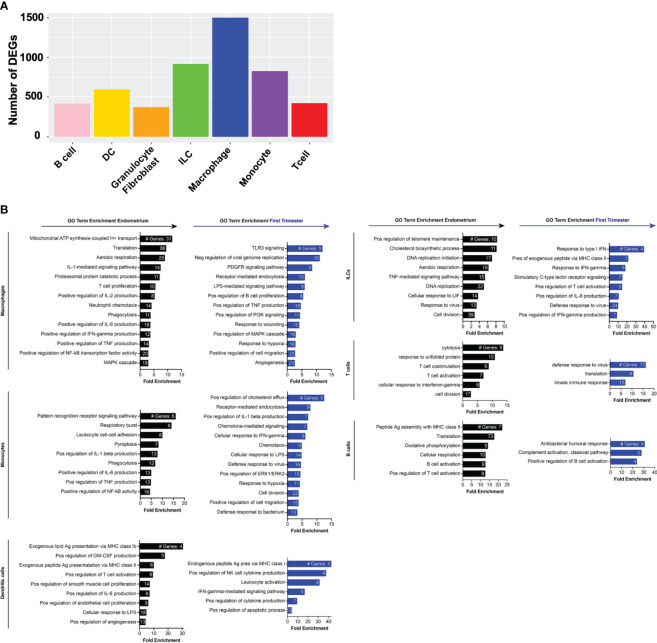
Figure 4.
Gene expression changes across superclusters in response to embryo implantation. (A) Bar graph showing absolute number of significant differentially expressed genes (DEGs) between endometrial and first trimester decidual CD45+ cells in indicated superclusters. Significant genes are defined as having an adjusted p value of <0.05 and an absolute fold change of 25% or greater (either ≥25% enriched in endometrium or ≥25% in decidua). (B) Gene ontology (GO) analysis of DEGs enriched in indicated endometrial (black) or first trimester decidual (blue) superclusters. GO terms significantly enriched are shown (false discovery rate [FDR] value ≤0.05). The x-axis shows fold enrichment of the indicated GO term on the y-axis. Embedded in the bars are the number of DEGs contributing to each GO term. If applicable, GO terms were shortened due to space restrictions and/or combined into one term that contained the most enriched genes. For instance, “negative regulation of viral genome replication”, “response to virus”, “viral entry into host cell”, and “defense response to virus” are GO terms that contain highly overlapping genes. Thus, only one of the terms was included. Additionally, such broad GO terms as “immune system process” and “inflammatory response” were not included in a dataset consisting only of immune cells.

