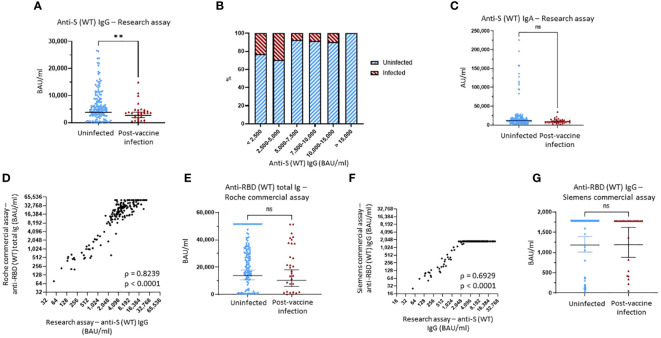
Figure 1.
Binding antibody serum levels against Wuhan-1 wild-type (WT) spike in research and commercial assays. (A) Comparison of anti-Wuhan-1 wild-type (WT) spike (S) IgG serum levels between the uninfected group and the post-vaccine infection (PVI) group. p-Values determined using the Mann–Whitney U test (p = 0.0098). (B) Percentages of uninfected vs. PVI participants depending on the anti-S IgG serum levels determined using the research assays. (C) Comparison of anti-S (WT) IgA serum levels between the uninfected group and the PVI group. p-Values determined using the Mann–Whitney U test (p = 0.1167). (D) Correlation between research assay anti-S (WT) IgG serum levels (BAU/mL) and Roche Elecsys® Anti-SARS-CoV-2 S assay anti-RBD (WT) total bAb serum levels (BAU/mL) in 171 samples (Spearman ρ = 0.8239; p < 0.0001). (E) Comparison of anti-RBD (WT) total bAb serum levels between the uninfected group and the PVI group using the Roche Elecsys® Anti-SARS-CoV-2 S assay. p-Values determined using the Mann–Whitney U test (p = 0.2138). (F) Correlation between research assay anti-S (WT) IgG serum levels (BAU/mL) and Siemens ADVIA Centaur® sCOVG assay anti-RBD (WT) IgG serum levels (BAU/mL) in 171 samples (Spearman ρ = 0.6929; p < 0.0001). (G) Comparison of anti-RBD (WT) IgG serum levels between the uninfected group and the PVI group using the Siemens ADVIA Centaur® sCOVG assay. p-Values determined using the Mann–Whitney U test (p = 0.4936). Dots indicate results from individual participants, and bars indicate geometric mean with 95% confidence intervals (CIs) in panels (A, C, E, G). Serum samples available for analysis: PVI group, n = 31; uninfected group, n = 140. **p < 0.01; ns, not significant.

